How to explore your data with "Group by" options
Insights data can be pivoted by key properties in order to view differences between groups.
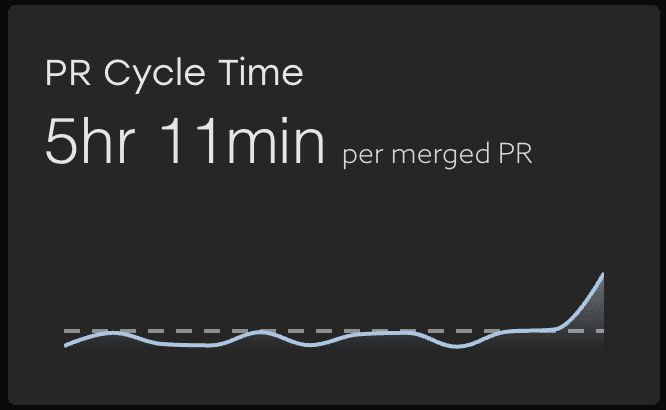
Imagine that Uplevel insights show a high-level trend across all the people in your selected segment.
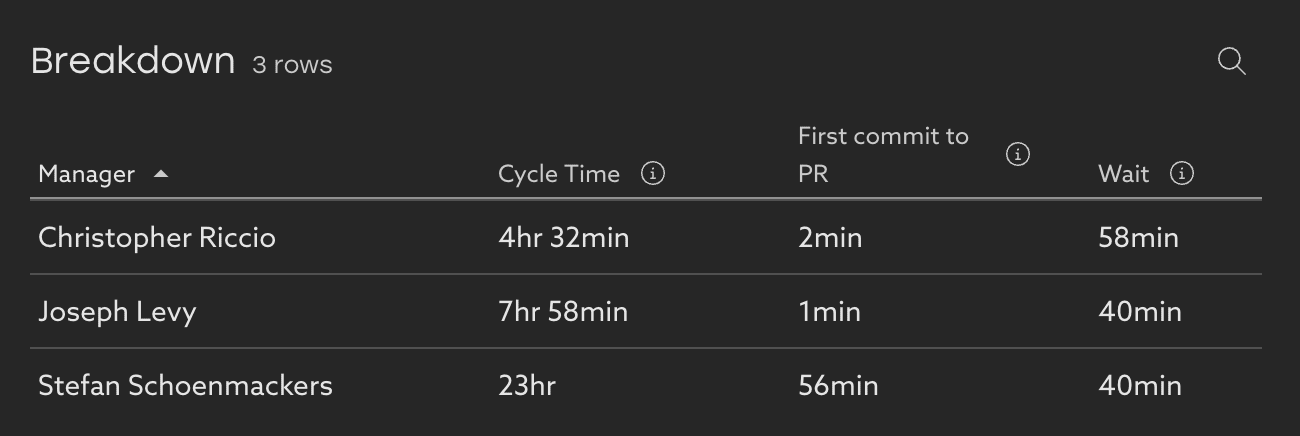
Clicking into the details provides a Table view with more detailed information. Here each row represents the data about individual teams. In this case, the data is Grouped By Manager (the default group option).
Let's change the grouping option to explore different pivots of the data.
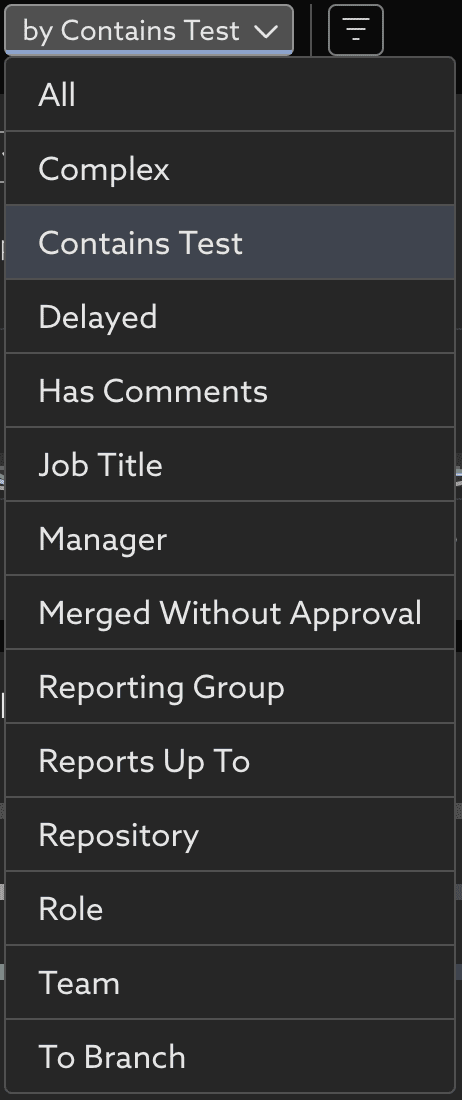
- Click the "By Manager" dropdown next to the insight title

- Select a new property to group the data. In this case we are looking at PR Cycle Time, and so the options available are properties of the PRs, or the people who opened the PR. Select "Contains Test."
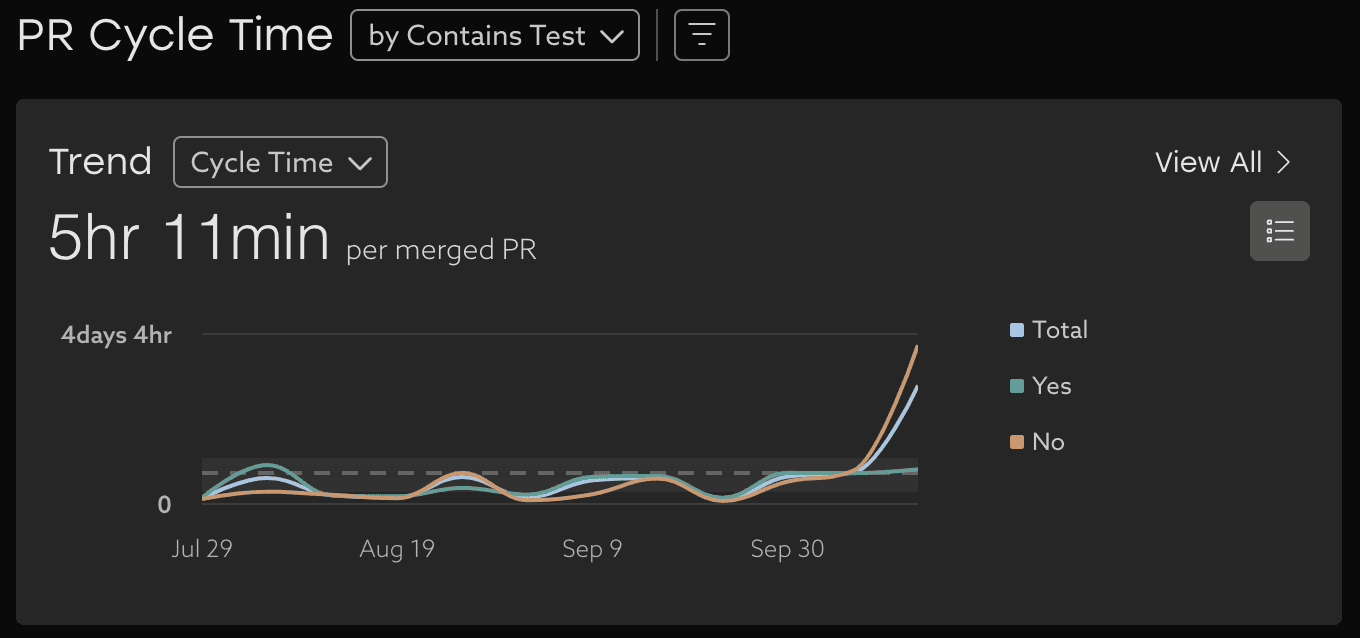
- Notice several elements of the page have changed:
- The trend chart is now broken down into a trend of Cycle Time for PRs that contain tests, PRs that don't contain tests, and a Total trend for all PRs.
- The breakdown table shows a separate row of data for the PRs that contain tests, and PRs that don't contain tests.
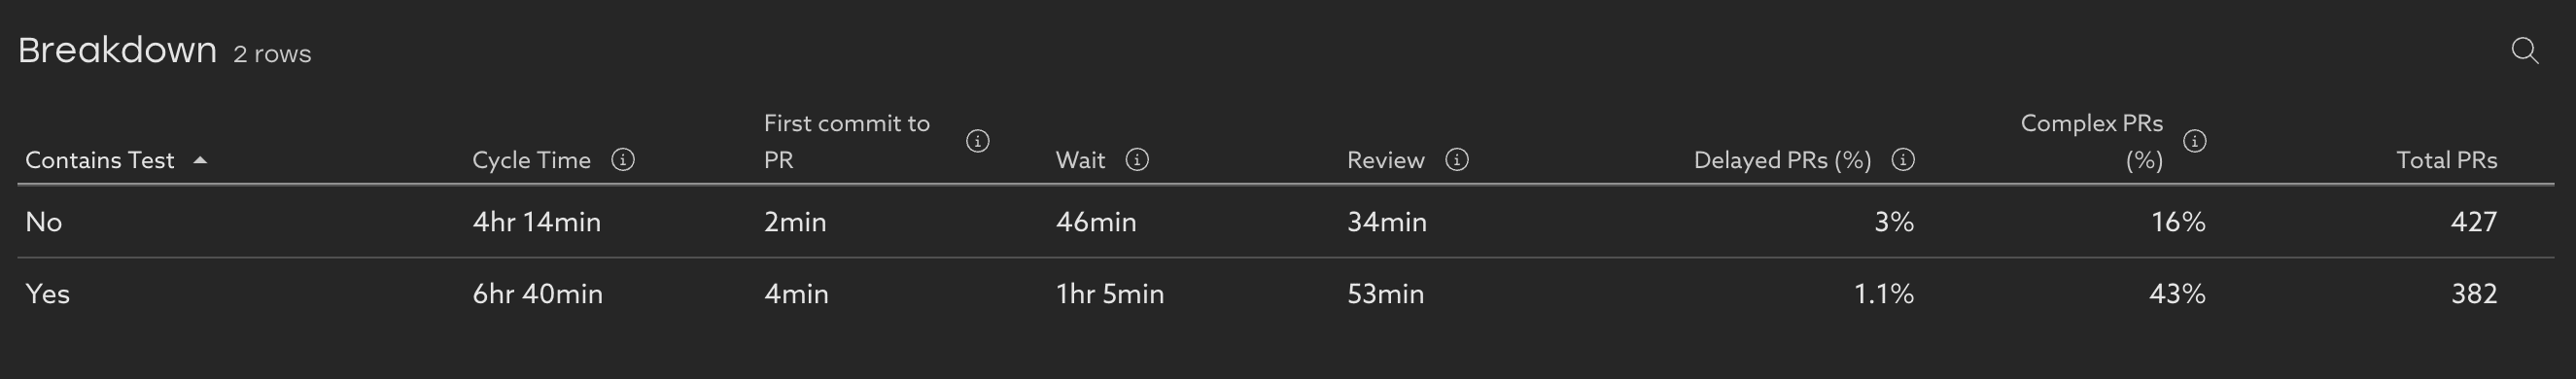
- The trend chart is now broken down into a trend of Cycle Time for PRs that contain tests, PRs that don't contain tests, and a Total trend for all PRs.
- Explore the data across any of the important properties that differentiate people and projects at your organization.

Note that the options available on each Insight are different based on the key properties in each different context. For example:
- Projects for Epic Lead Time
- Priority for Change Failure Rate
- Repository for Deployment Frequency
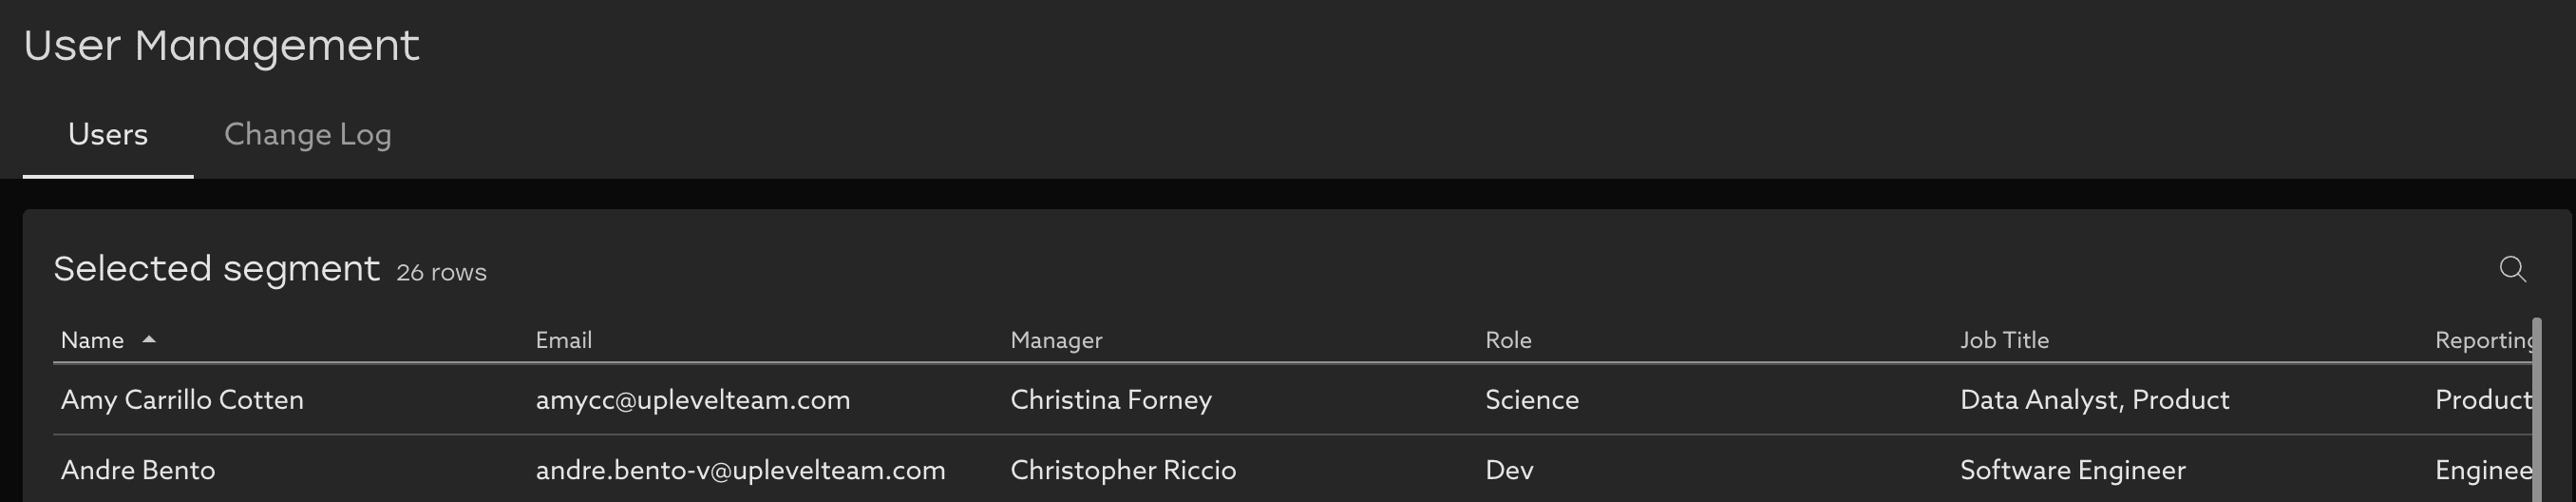
Look to the User page to see the unique properties available on each person, and what group each person is in.
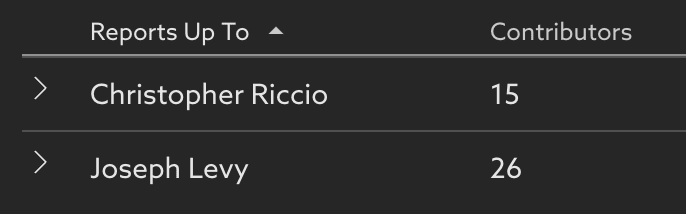
Group by "Reports Up To" to see all the individuals who report to a leader in the organization. Note that individuals will be in multiple groups in this view, as they report up to their Director, VP, CEO, etc.
Related Articles
How to find bottlenecks slowing down PRs
Learn how to navigate your organization's Cycle Time data and how you can take action to mitigate risk Trend Learn about your organization by analyzing your cycle time trends over time. With this view, you can easily see where delays happen and take ...How to find your team's data using default segments
Scope Uplevel to your team By default, Uplevel displays a broad overview of your organization. You may want to narrow down to see a subset of that organization. To choose which set of users are included in that selection, click the Segment dropdown ...How to use Uplevel to find velocity opportunities
The first step towards increasing velocity is finding where your biggest opportunities lie. There are a variety of venues through which opportunities in velocity can be found. Note that affecting/changing velocity comes later, and can be explored in ...Advanced Filtering and Grouping
Find stories in the data with new filtering and grouping tools. Filtering and grouping options in Uplevel insights allow more powerful options for exploring the data and finding outliers. Grouping Select groups that make sense for summarizing the ...Bug Rate
Learn about your organization's bug practices and how they've changed over time. Trend This metric shows the percentage of issues closed during the time period that were bugs. An issue is considered a bug if it has an issue type that contains the ...