Bug Rate
Learn about your organization's bug practices and how they've changed over time.
Trend
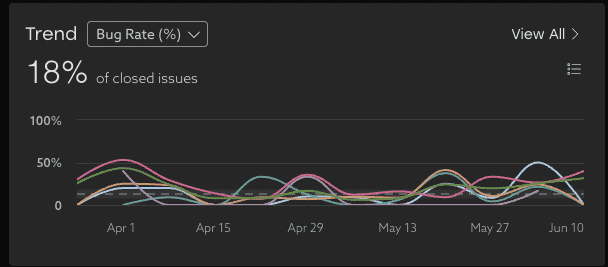
This metric shows the percentage of issues closed during the time period that were bugs. An issue is considered a bug if it has an issue type that contains the term "bug" or "defect". Each dot on the line represents a week during that period.
These trends show the total bug rate, and the top 10 groups with the highest bug rate in this period.
All bugs counted here are currently assigned to the selected segment.
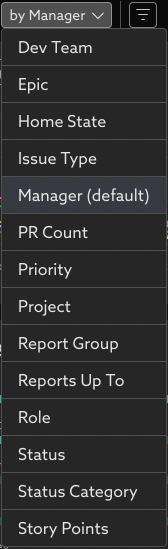
Group Options
By default, groups are based on manager, but can be pivoted by other options such as by project, priority, or role.
Closed Bugs
View the count of bugs closed each week (the trendline) compared to the total number of issues closed.

Opened Bugs
View the count of bugs opened each day of the selected time period. This view helps you understand patterns and spot unusual spikes.

Closed Bugs by Group
Use this view to understand the bug count for each group for the selected time period.

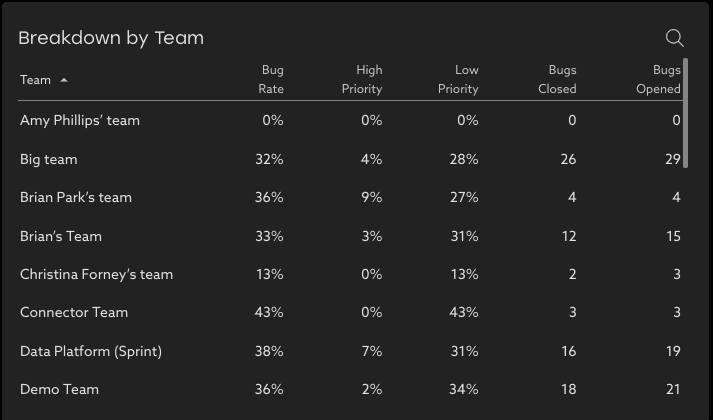
Breakdown by Group
See the bug activity for the period for each group to understand where load balancing could be beneficial. Bugs are counted against the group they are currently assigned to.
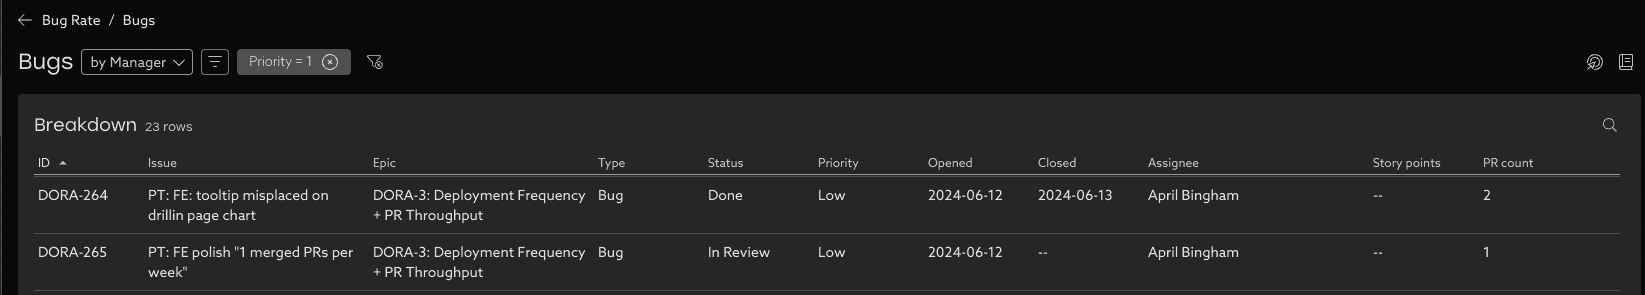
Detailed Drill-in
See the individual bugs behind these insights by clicking View All or a group in the breakdown table.
Filters
Advanced filtering options allow focusing on the trends of specific projects, issue types, or groups with highest or lowest bug rate.

Related Articles
Change Failure Rate (CFR)
What is Change Failure Rate? Change Failure Rate is one of the four key DORA metrics that measures how frequently changes to production result in degraded service that requires remediation. To calculate this, Uplevel analyzes the sequence of ...Advanced Filtering and Grouping
Find stories in the data with new filtering and grouping tools. Filtering and grouping options in Uplevel insights allow more powerful options for exploring the data and finding outliers. Grouping Select groups that make sense for summarizing the ...Deployment Frequency
What is Deployment Frequency? Deployment Frequency uses your Github Actions data to calculate the number of successful deployments to production a group of people has in a given time period. It is an indication of how frequently and consistently ...How to explore your data with "Group by" options
Insights data can be pivoted by key properties in order to view differences between groups. Imagine that Uplevel insights show a high-level trend across all the people in your selected segment. Clicking into the details provides a Table view with ...Uplevel's 2-Week Sliding Calculation Window
Balancing the tradeoffs between leveraging the latest information and maintaining integrity in reporting. Data from your source systems (JIRA/Git/Calendar/Slack/etc.) is fluid. While a JIRA issue may have been classified as a "story" at one point in ...