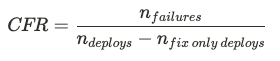
Change Failure Rate (CFR)
Change Failure Rate is one of the four key DORA metrics that measures how frequently changes to production result in degraded service that requires remediation. To calculate this, Uplevel analyzes the sequence of deployments to production in a given repository.
Consider the scenario where a code change was deployed to production, but it contained a defect that was missed during review. This degraded service, so the next day, a hotfix PR was written was written and deployed to production to restore service. In this scenario, the first deployment (containing the defect) would be considered a "failure".
How is CFR Calculated?
Failures
These are deployments to production environments that are followed a subsequent deployment that includes work that signifies there was defect remediation. Uplevel estimates this by analyzing the PR branch name and title, as well as linked Jira ticket titles and issue types, looking for the following keywords: bug|incident|security risk|defect|vulnerability|hotfix|coldfix|patch|fix forward|rollback
Uplevel also looks for rollback deployments that could indicate that there was a problem with a previous deployment.
Additionally, Uplevel takes timestamps of work into account to avoid bug/polish work that was started before a code change was live in a production environment.
Successes
These are deployments to production that are not followed by repair work. These represent the majority of deployments that are observed by Uplevel.
Fix-only
These are deployments that are observed to only contain repair work. E.g., every PR contained meets the criteria described above OR a deployment is a rollback. Since these deployments aren't planned changes to production, they are removed from the calculation of CFR described below.
Consider the following sequence of deployments:
- A successful, routine deployment.
- A deployment that is estimated to include a defect (i.e., a failure)
- A rollback, which only would have occurred to remediate the defect of the previous deployment.
How are Deployments to Production Defined?
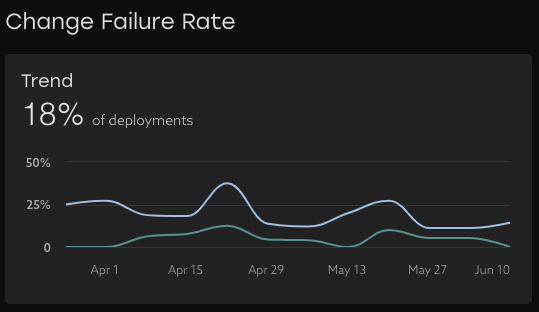
Deployment Frequency Charts
Trend

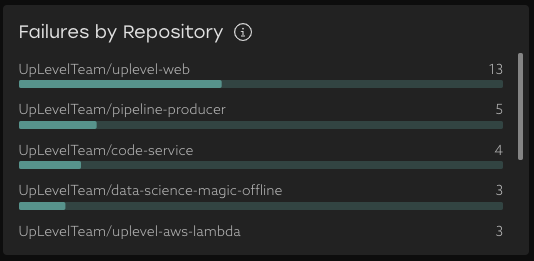
Failures by Repository
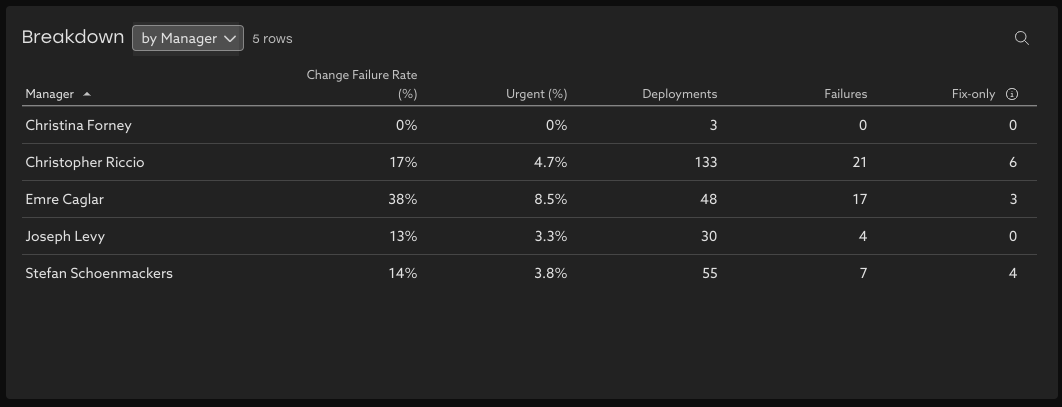
Breakdown Table
Related Articles
Bug Rate
Learn about your organization's bug practices and how they've changed over time. Trend This metric shows the percentage of issues closed during the time period that were bugs. An issue is considered a bug if it has an issue type that contains the ...How to explore your data with "Group by" options
Insights data can be pivoted by key properties in order to view differences between groups. Imagine that Uplevel insights show a high-level trend across all the people in your selected segment. Clicking into the details provides a Table view with ...Advanced Filtering and Grouping
Find stories in the data with new filtering and grouping tools. Filtering and grouping options in Uplevel insights allow more powerful options for exploring the data and finding outliers. Grouping Select groups that make sense for summarizing the ...User Administration
Admins can make updates to their org chart directly in the Uplevel dashboard. One of the primary ways information is organized in the Uplevel Dashboard is based on the teams of people that work together. On a recurring basis, Uplevel imports an ...Pulse Page
Understanding important changes over time at a glance Metric Trends on the Pulse Page highlight the insights with the largest recent change, to highlight where focus is needed, and where efforts to improve are showing the biggest impact. It's ...