Pulse Page
Understanding important changes over time at a glance
Metric Trends on the Pulse Page highlight the insights with the largest recent change, to highlight where focus is needed, and where efforts to improve are showing the biggest impact.
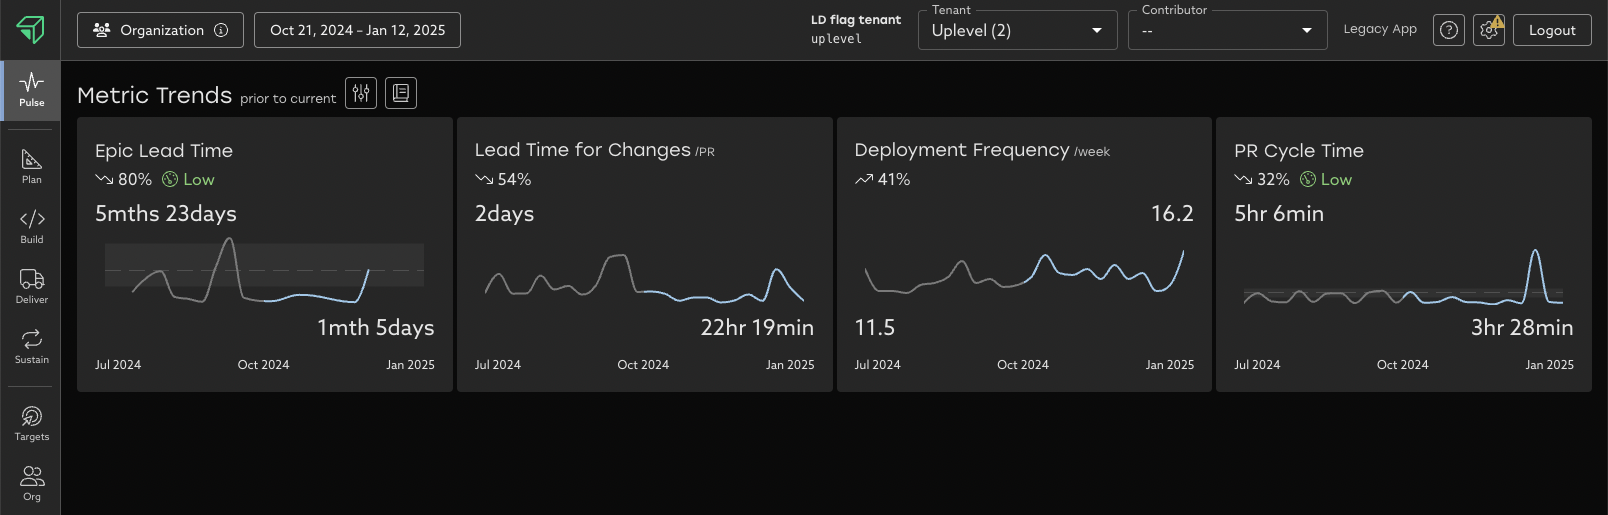
It's important to understand not just your current metrics, but how these compare to the past. The Pulse Page provides this story at a glance by showing both the recent and previous values (by default, from the most recent 12 weeks and the value from the previous period that spans the same amount of time).
Pulse Page Customization
By default, Metric Trends highlight the insights with the largest recent change. Use the Options menu to pin any insight so it always appears.
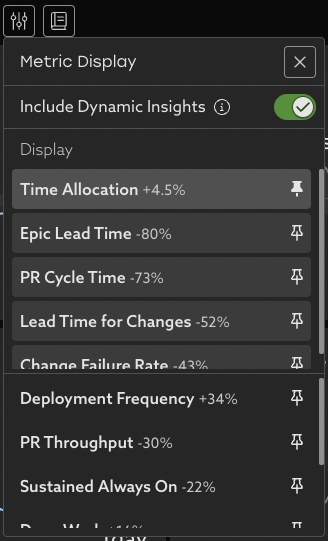
When Include Dynamic Insights is enabled, the top 4 largest changing insights will always be shown. Turn this off in order to only show the pinned insights.
AI Investment Summaries
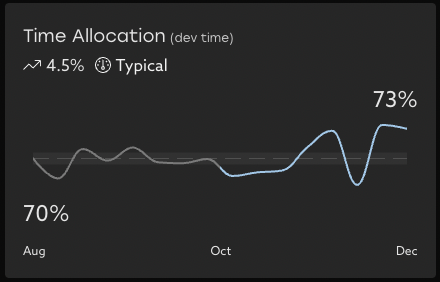
The pulse page also helps teams understand their top investments across a period of time. These tiles show the fraction of the team's time invested in a specific area, how that has changed since the previous period, and AI summarizations of what the work was specifically about.
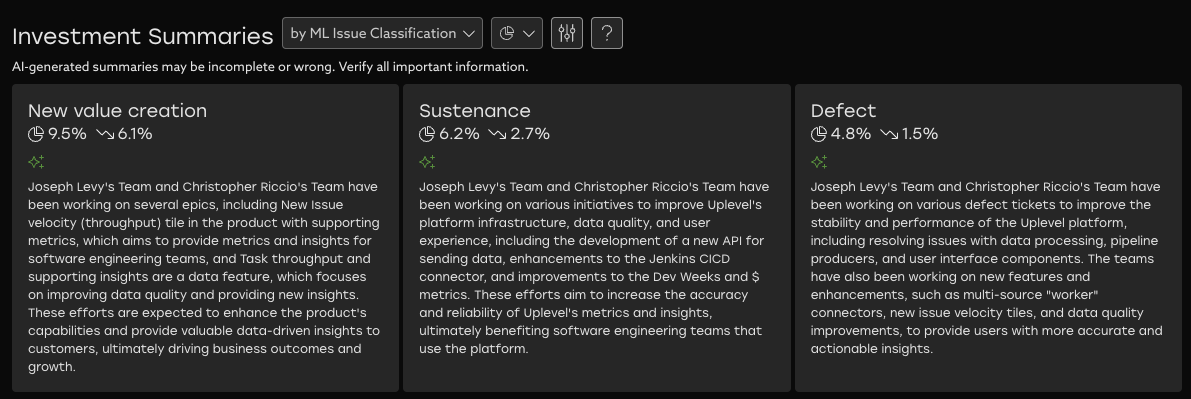
Investment summaries are generated by leveraging Jira/ADO issue metadata with a privately running LLM (Large Language Model). The LLM runs on Amazon Bedrock, and data sent is not stored, used for training, nor shared with any third parties. As with all AI products, these descriptions may be incomplete or wrong. Please verify all important information.
These summaries give leaders the ability see what teams are working on at a glance, without needing to ask the team lead — especially for work that isn't linked to Epics or up to parent initiatives.
Related Articles
AI Investment Summaries
Understand details of what your team has been working on at a glance What are AI Investment Summaries? Shown on the Pulse Page, AI Investment summaries are now available for all allocation schemes. These summaries give engineering leaders a short ...How to set a metric target
Set targets for metrics and teams to help drive change in your org. Targets can now be set on any key insights directly within the dashboard. This feature is designed to empower every team to actively participate in setting goals and tracking ...How to explore your data with "Group by" options
Insights data can be pivoted by key properties in order to view differences between groups. Imagine that Uplevel insights show a high-level trend across all the people in your selected segment. Clicking into the details provides a Table view with ...Deployment Frequency
What is Deployment Frequency? Deployment Frequency uses your Github Actions data to calculate the number of successful deployments to production a group of people has in a given time period. It is an indication of how frequently and consistently ...Including and excluding former employees
When looking at historic trends, it is sometime helpful to focus on current or former employees in the analysis. The makeup of an organization changes over time as employees join and leave. When looking at historic trends, it is sometimes helpful to ...