Deployment Frequency
What is Deployment Frequency?

Deployment Frequency uses your Github Actions data to calculate the number of successful deployments to production a group of people has in a given time period. It is an indication of how frequently and consistently teams are able to deliver new value to customers and end-users.
Monitor this data in your Uplevel Dashboard to make sure your teams are deploying regularly.
How are Deployments to Production Defined?
Deployments to production are estimated for each repository by the environments configured within Github Actions. Uplevel uses an organization wide regular expression (Regex) to find for production environments, but exclude non-production environments. An example is shown below that looks for environments that contain the strings
prod|live|release, but excludes pre-prod|pre-release and other variants, as well as explicitly excluding qa and staging environments.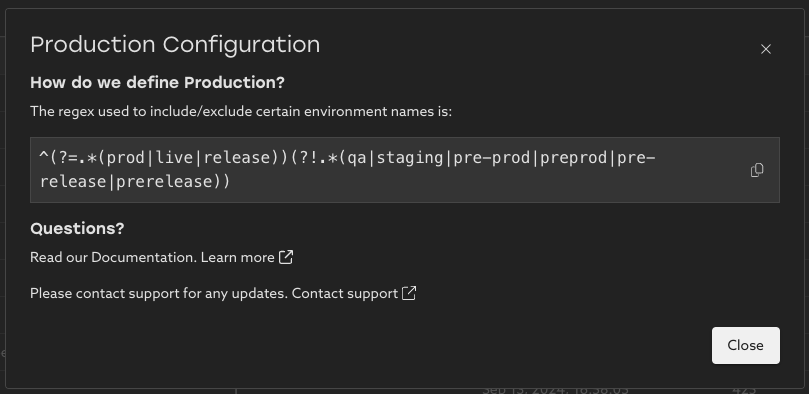
Your organization's global definition is visible by visiting the configuration page and clicking on an environment. Learn more about how to utilize this page here.
Trend
See your organization's deployment trend over time. This chart shows the number of successful deployments to production in the date range selected.
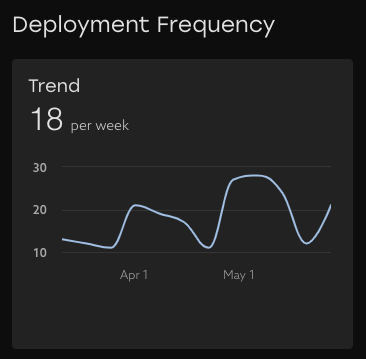

Tip: the main thing to look for is consistency here. Deploying often benefits teams in keeping practices and procedures smooth and repeatable.
Success Rate
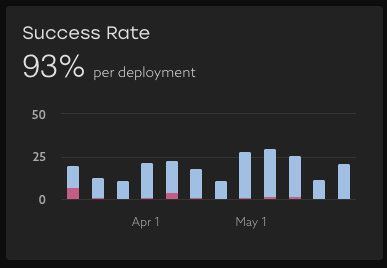
Observe how frequently your teams' deployments are successful across all environments with successful deployments shown in blue, and unsuccessful deployments shown in pink. If there are groups with lower-than-average success rates, then having a conversation about why those deployments are consistently failing may highlight some areas for improvement.
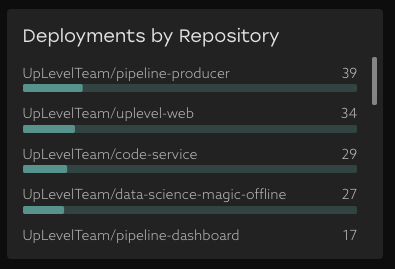
Deployments by Repository
Understand where your teams are deploying changes. This chart shows the top repositories and the percentage of deployments that were attributed to them. The length of the bar shows the fraction of deployments to this repository out of all deployments to production.
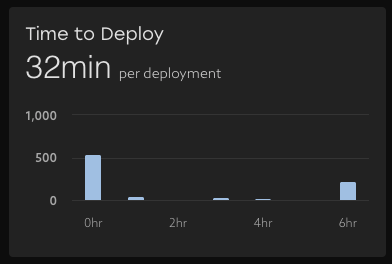
Time to Deploy
Understand how long deployment jobs are taking. This metric is calculated using the start and end timestamps of the respective workflow run. This could include build time as well, depending on how your CI/CD Workflow is configured.
Breakdown by team
Explore the data to learn how frequently teams successfully deploy code, how often deployments go to production environments, the success rate of deployment workflows across all environments, as well as the median time it takes workflows to run. This table can be pivoted both by people properties like team and report group, as well as Repository.
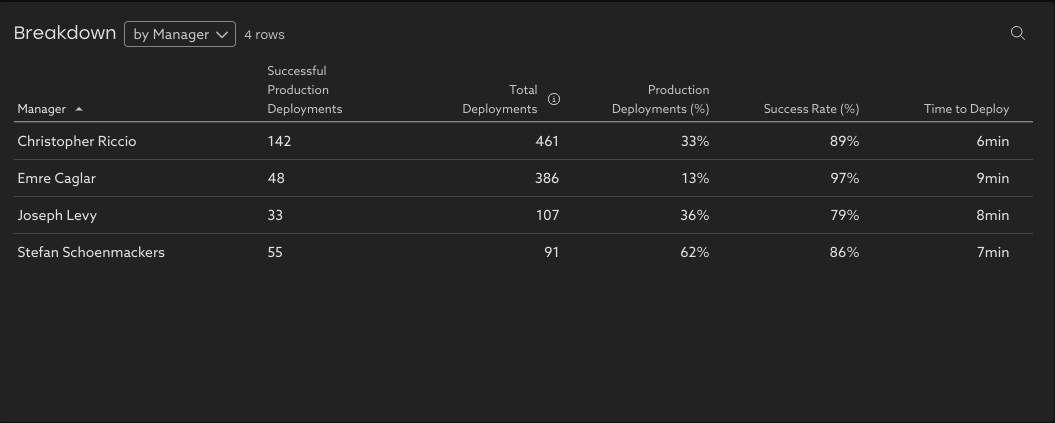
Note that Uplevel attributes deployments to both the person that initiated the deployment workflow, as well as authors of PRs that were included in a deployment. This means that a single deployment can count for multiple groups of people in the breakdown table. Additionally, a person can be a member of multiple segments. These will cause the sum of successful production deployments in this breakdown to be slightly greater than the totals shown above.
Example: a ‘Manager’ segment where the manager is in their own team’s segment (e.g., Chris Riccio's Team), in addition to being part of their manager’s team (Joseph Levy's Team).
Tip: If there are repositories or groups of people with low success rates and/or long Time to Deploy, then it could merit a conversation about what's leading to these statistics. There may be an opportunity to find process improvements that speed things up and improve developer experience.
Related Articles
Change Failure Rate (CFR)
What is Change Failure Rate? Change Failure Rate is one of the four key DORA metrics that measures how frequently changes to production result in degraded service that requires remediation. To calculate this, Uplevel analyzes the sequence of ...How to explore your data with "Group by" options
Insights data can be pivoted by key properties in order to view differences between groups. Imagine that Uplevel insights show a high-level trend across all the people in your selected segment. Clicking into the details provides a Table view with ...How to use Uplevel to find velocity opportunities
The first step towards increasing velocity is finding where your biggest opportunities lie. There are a variety of venues through which opportunities in velocity can be found. Note that affecting/changing velocity comes later, and can be explored in ...PR Throughput
Learn about your organizations code delivery practices and how they've changed over time. What is PR Throughput? PR Throughput counts the number of merged PRs a group has collectively authored in a given time period. It is an indication of how ...