How to use Uplevel to find velocity opportunities
| Deployments |
|
| Epics/JIRA |
|
| Code/PR's |
|
Code/PRs
PRs are the smallest chunks of work in your organization. Measuring how quickly these aggregations of work move through the process, can give you a high fidelity view into velocity.
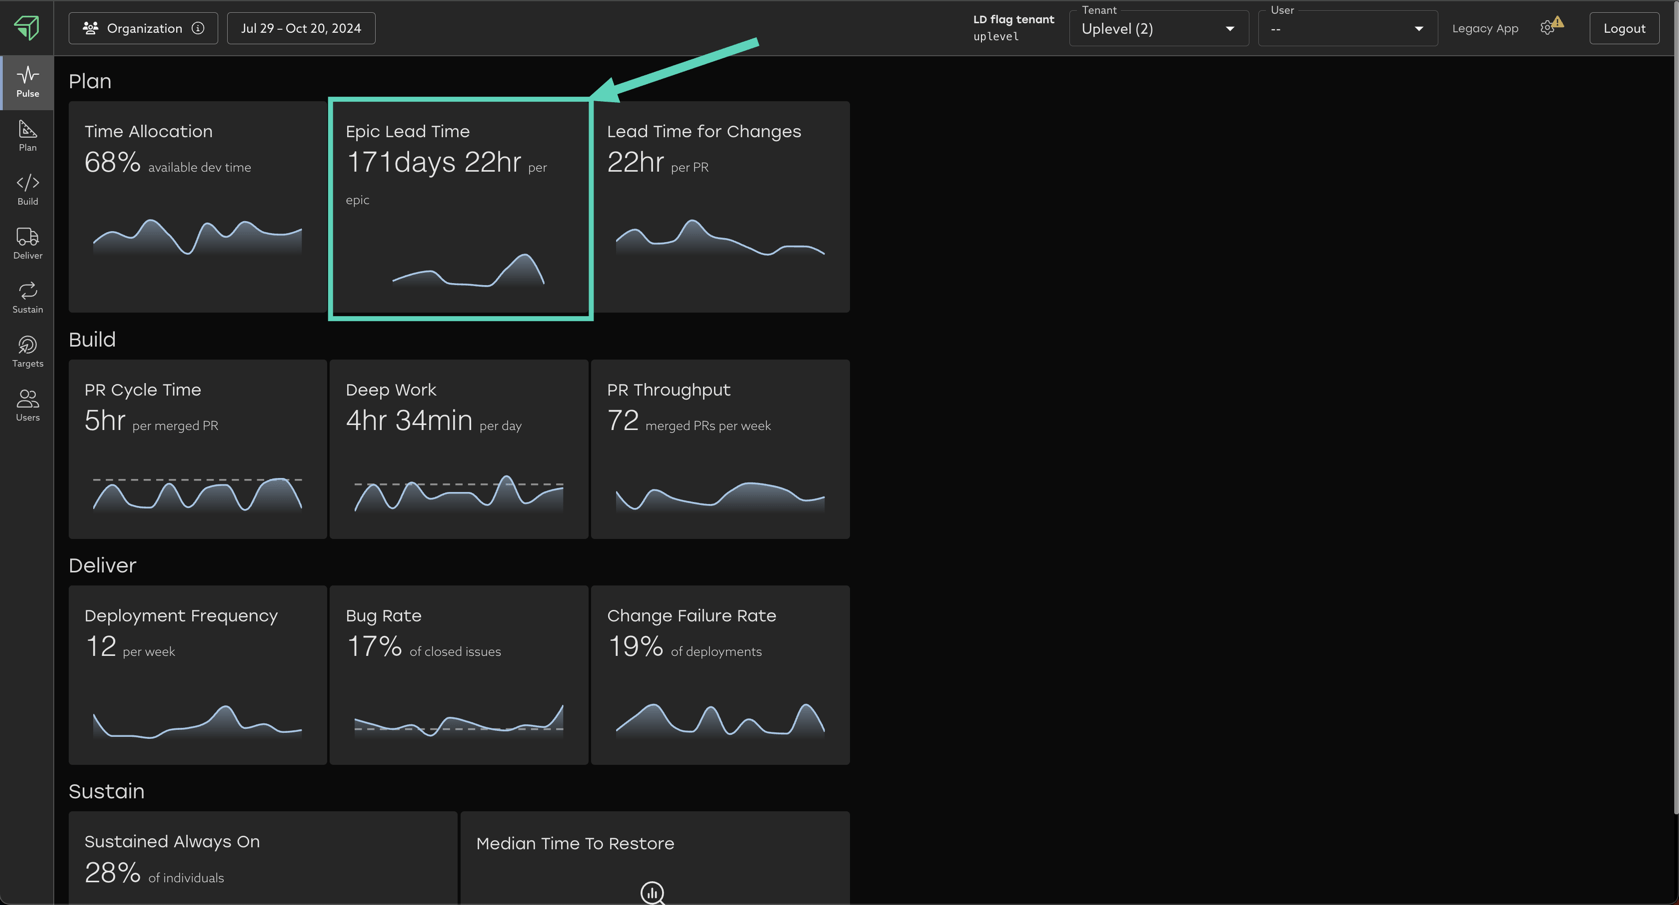
Uplevel's Build Tab provides a drill-in experience for Code/PR velocity. Let's use it to find some opportunities for improvement below.
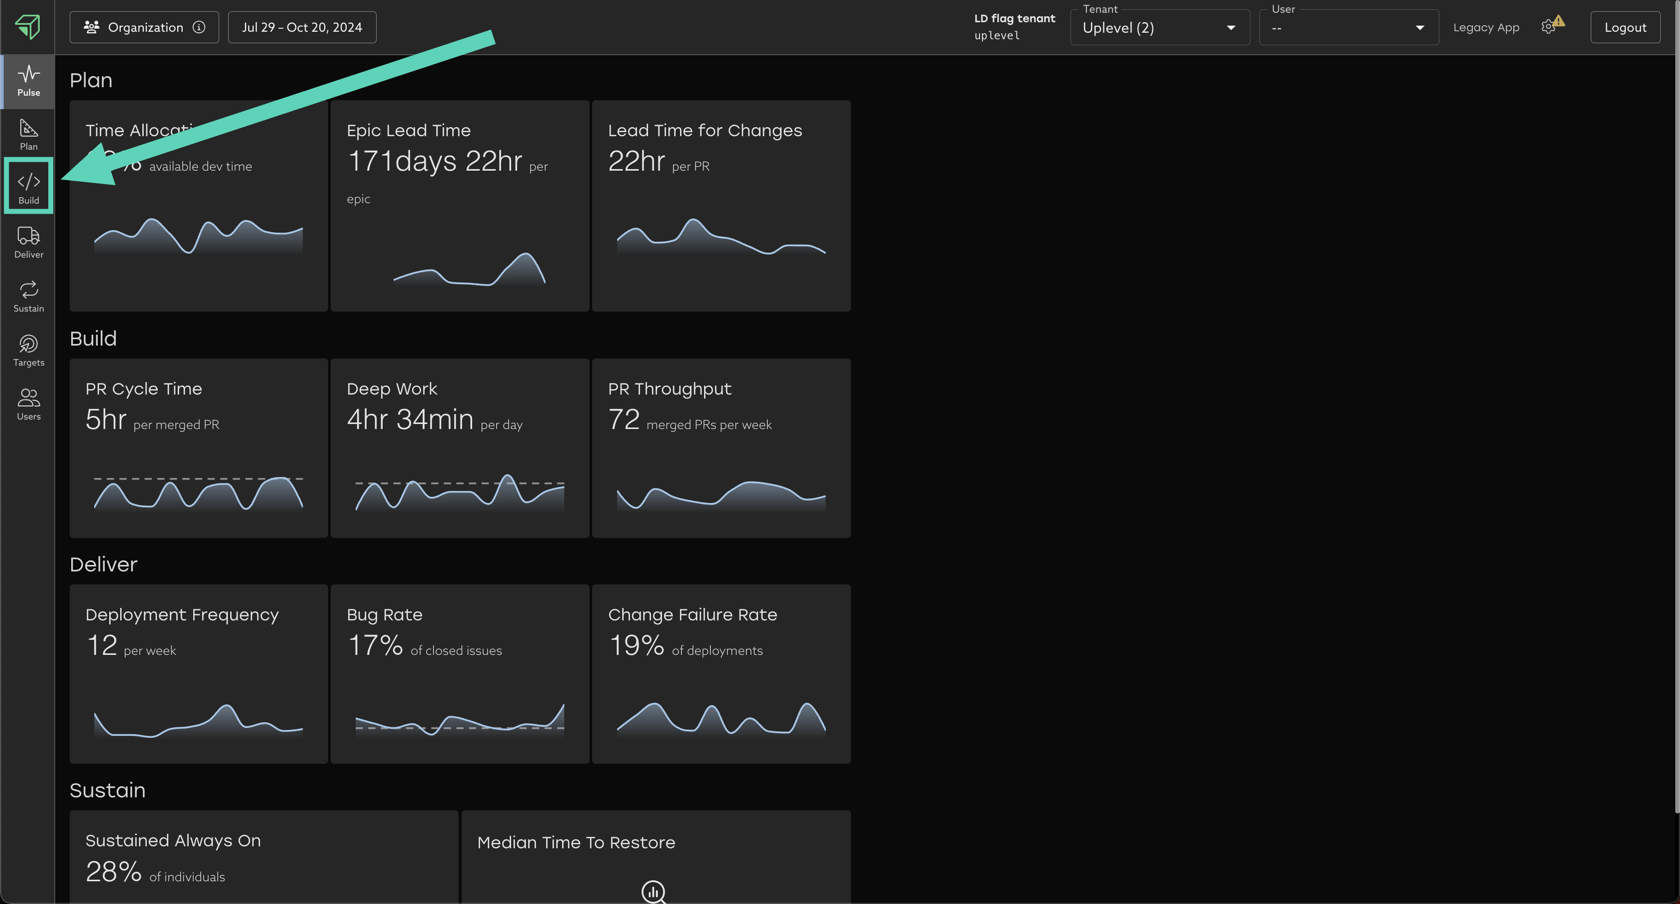
There are 3 toggles in the Build Tab that you can use to look for opportunities:
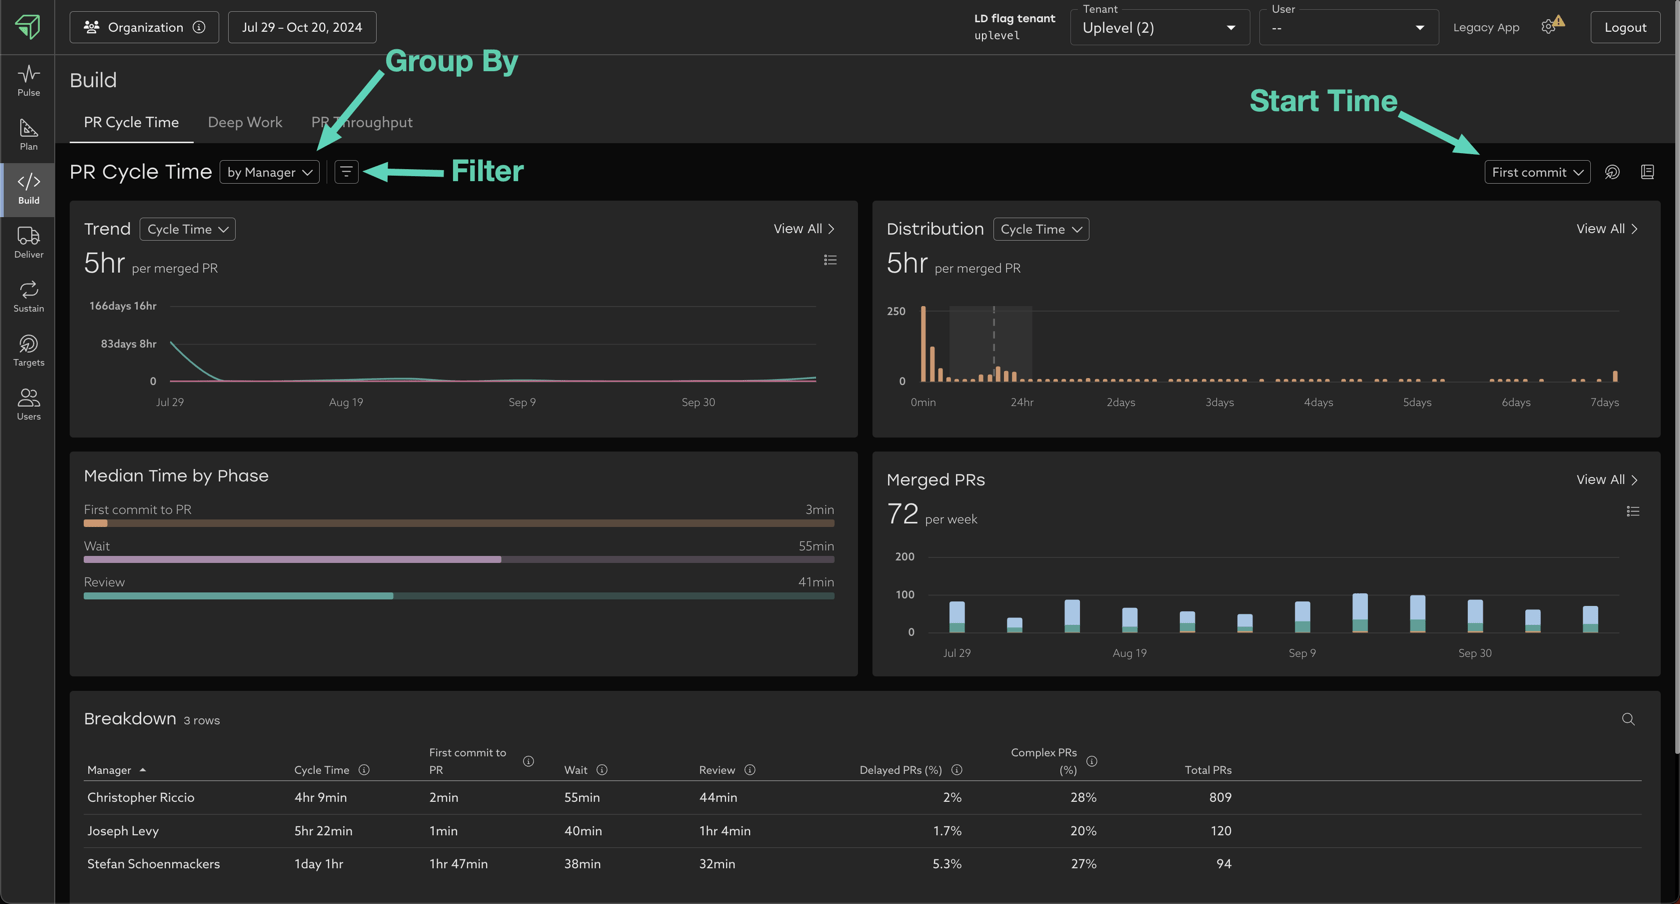
- Group By - Group PR's by different attributes to compare trends.
- Filter - Remove stale PR's, irrelevant repositories, and more.
- Group attribute filters remove entire rows from the breakdown table.
- Ex. filter out all teams that already meet or exceed Uplevel's benchmark.
- User attribute filters remove individual people from your dataset.
- Ex. filter out senior devs.
- PR attribute filters remove individual PR's from your dataset.
- Ex. filter out outliers such as "stale PR's" that took many days or weeks to be merged.
- Start Time - Configure the start of Cycle Time to be either first commit of first activity. More detail on tradeoffs can be found here.
Your goal is to look for "unevenness" across the data, which allows you to begin targeted, data-driven investigations.
Overlaying your context on top of the Uplevel data is key, as only you know all the different ways of working in your organization, and what levels of unevenness may or may not be appropriate.
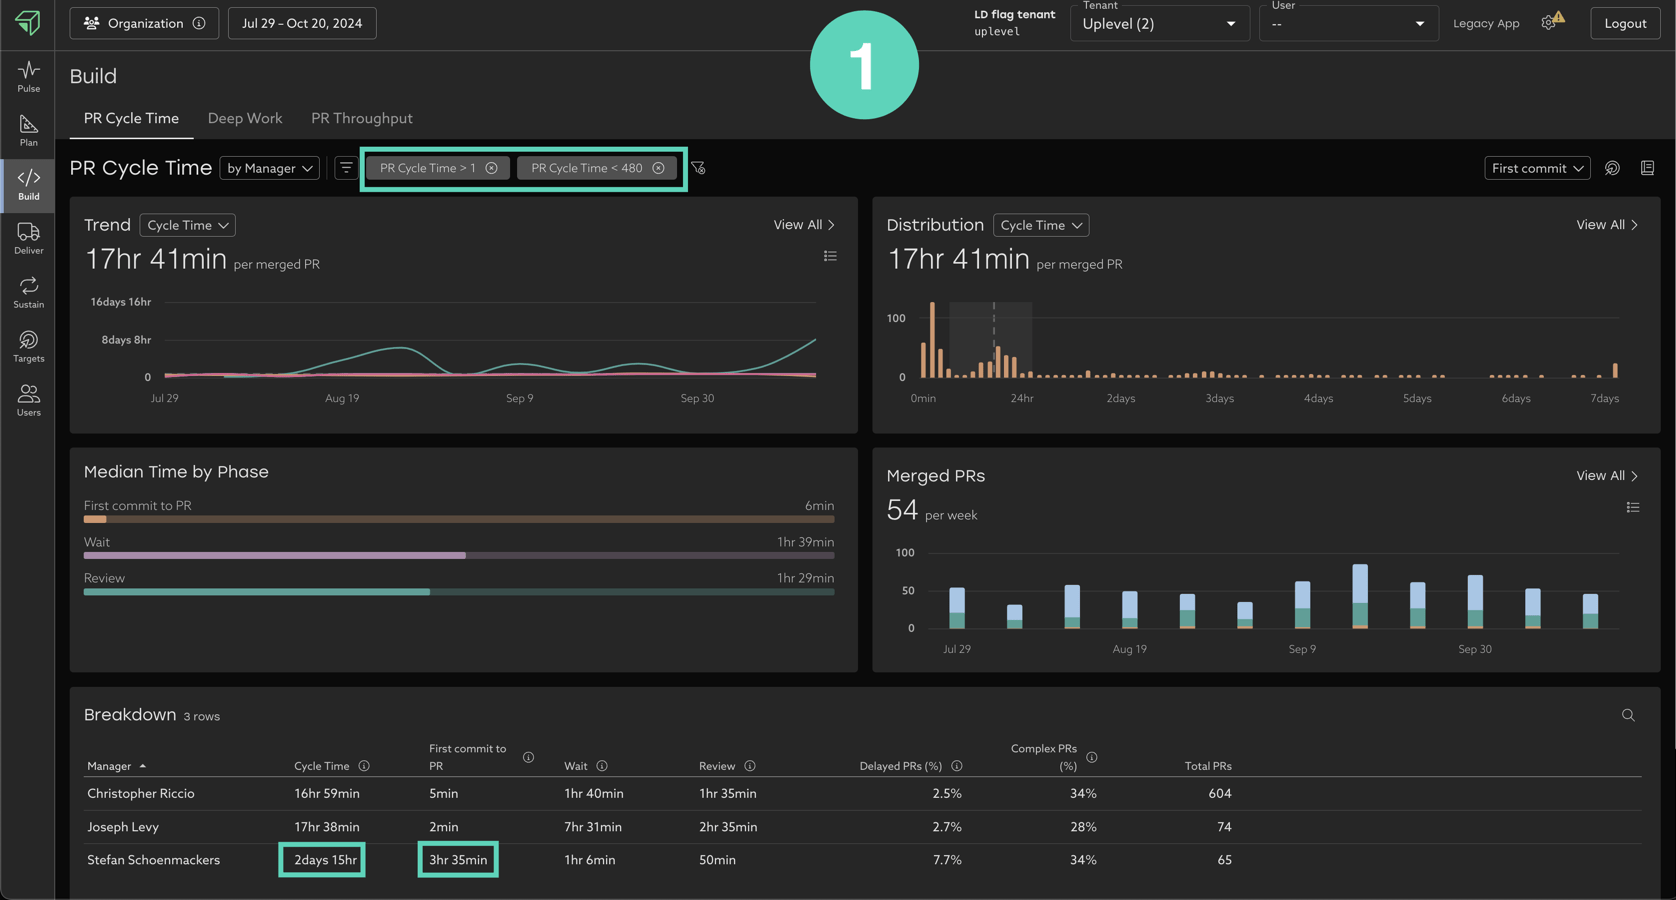
In the below example, for the same group of people and set of dates, altering the group by, filter, and start time inputs uncovers different opportunities to increase velocity:
- By removing the high and low outlier PR's, we reveal that Stefan's team has significantly slower Cycle time than his peers' teams. A lot of this slowness seems to be concentrated in the "first commit to PR" phase. Based on his team's context, this may be an issue.
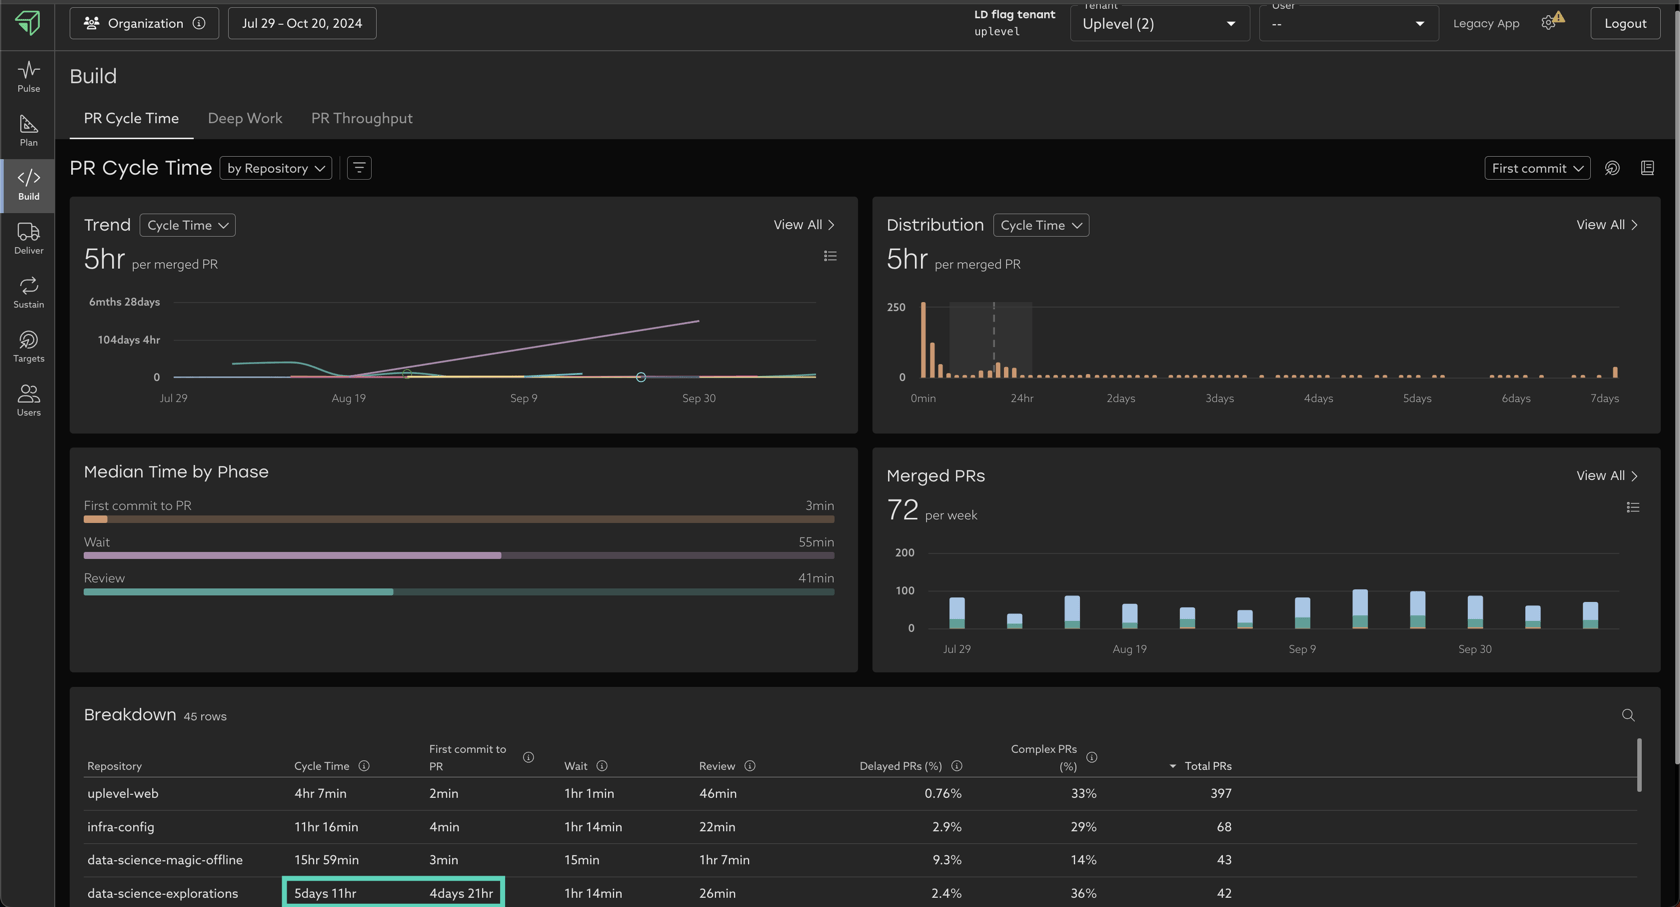
- Figure 2/3 - By grouping by repository, we reveal that the data-science-explorations repository seems to much slower than this organization's other largest repos. Again, a lot of this slowness seems to be concentrated in the "first commit to PR" phase. Based on his repo's context, this may be an issue.
Epics/JIRA
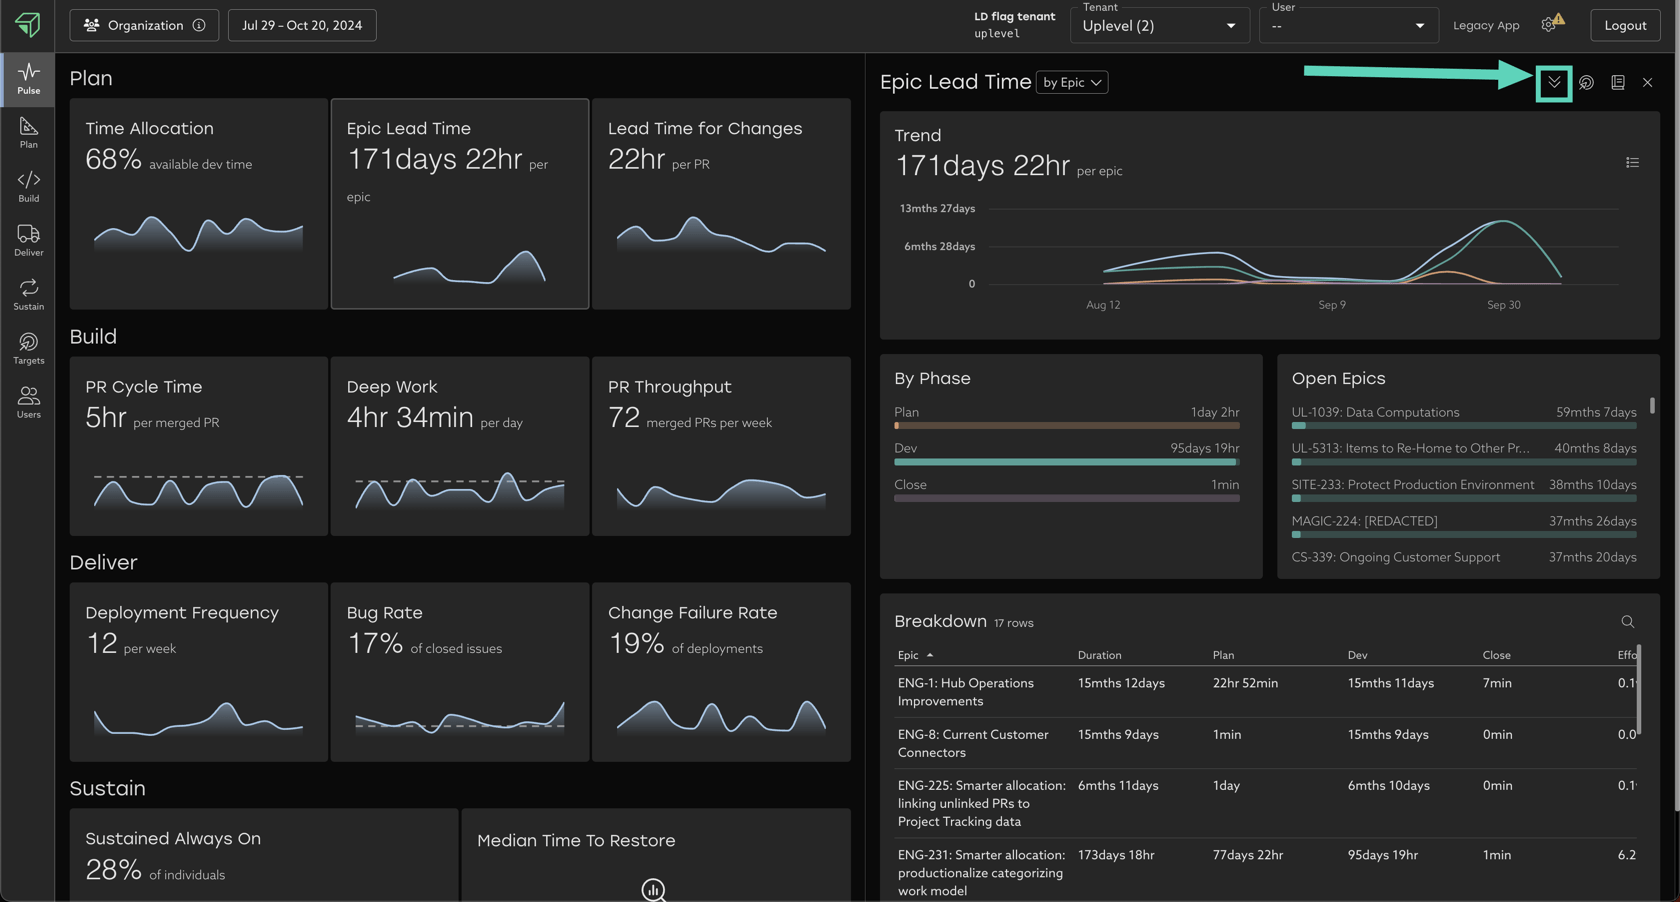
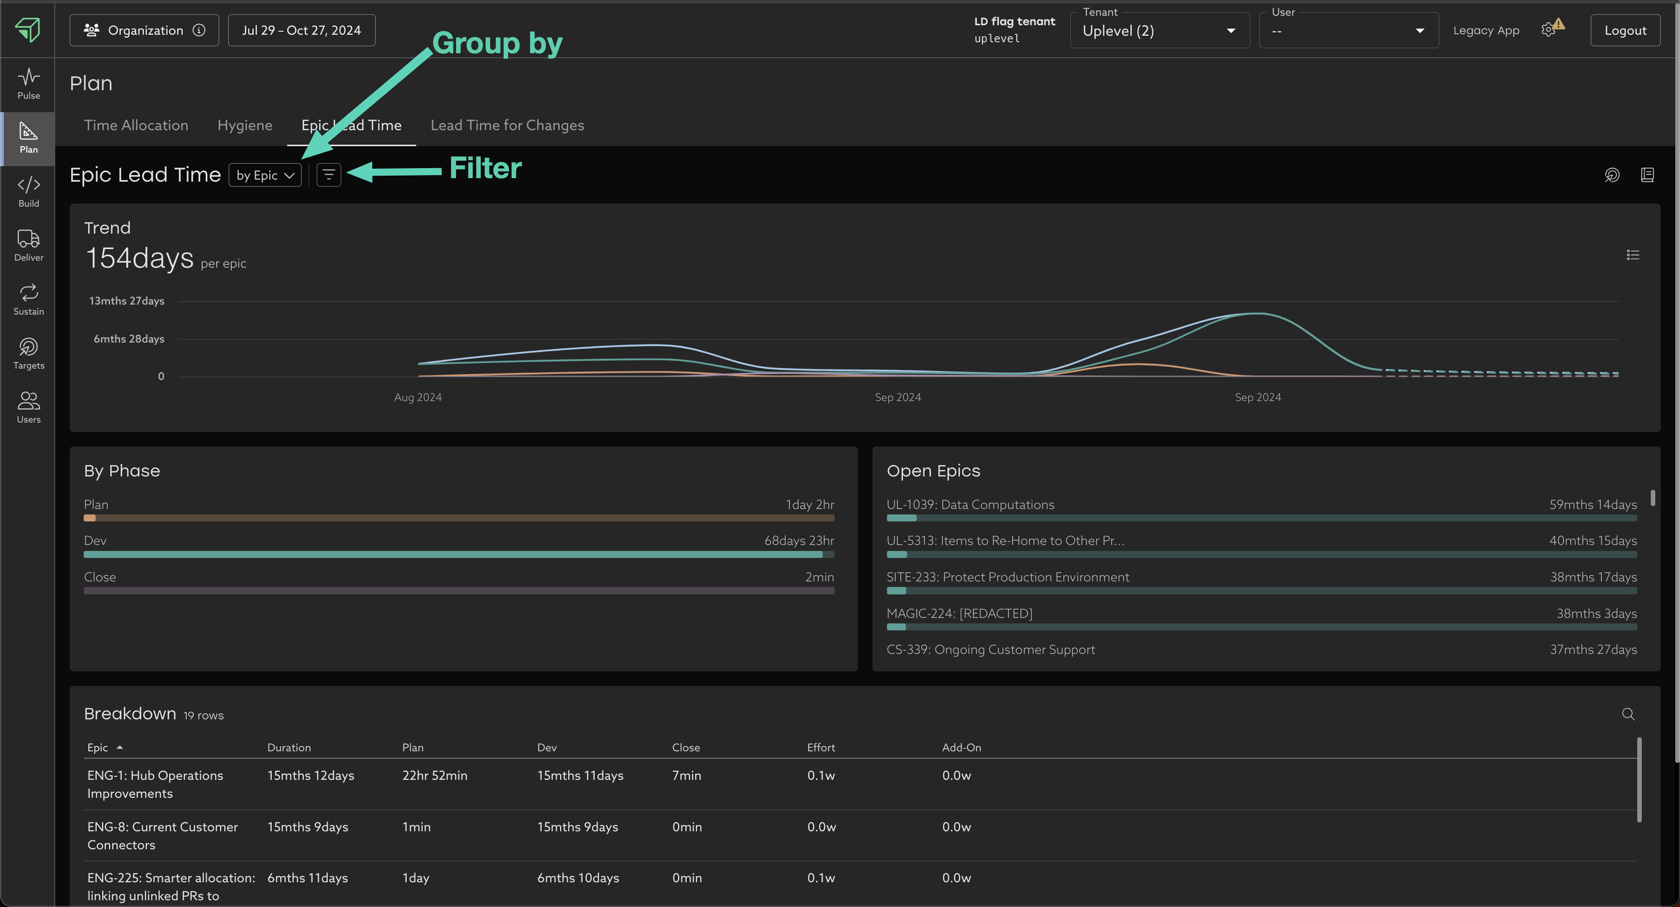
- Group By - Group Epics by different attributes to compare trends.
- Filter - Remove stale Epics, irrelevant projects, and more.
- Group attribute filters remove entire rows from the breakdown table.
- Ex. filter out all epics that already faster than your organization's org-wide median.
- Epic attribute filters remove individual Epics from your dataset.
- Ex. filter out outliers such as "stale Epics" that took more than 100 days to be closed.
Exactly the same as with Cycle Time earlier, your goal is to look for "unevenness" across the data, which allows you to begin targeted, data-driven investigations.
Overlaying your context on top of the Uplevel data is key, as only you know all the different ways of working in your organization, and what levels of unevenness may or may not be appropriate.
Deployments
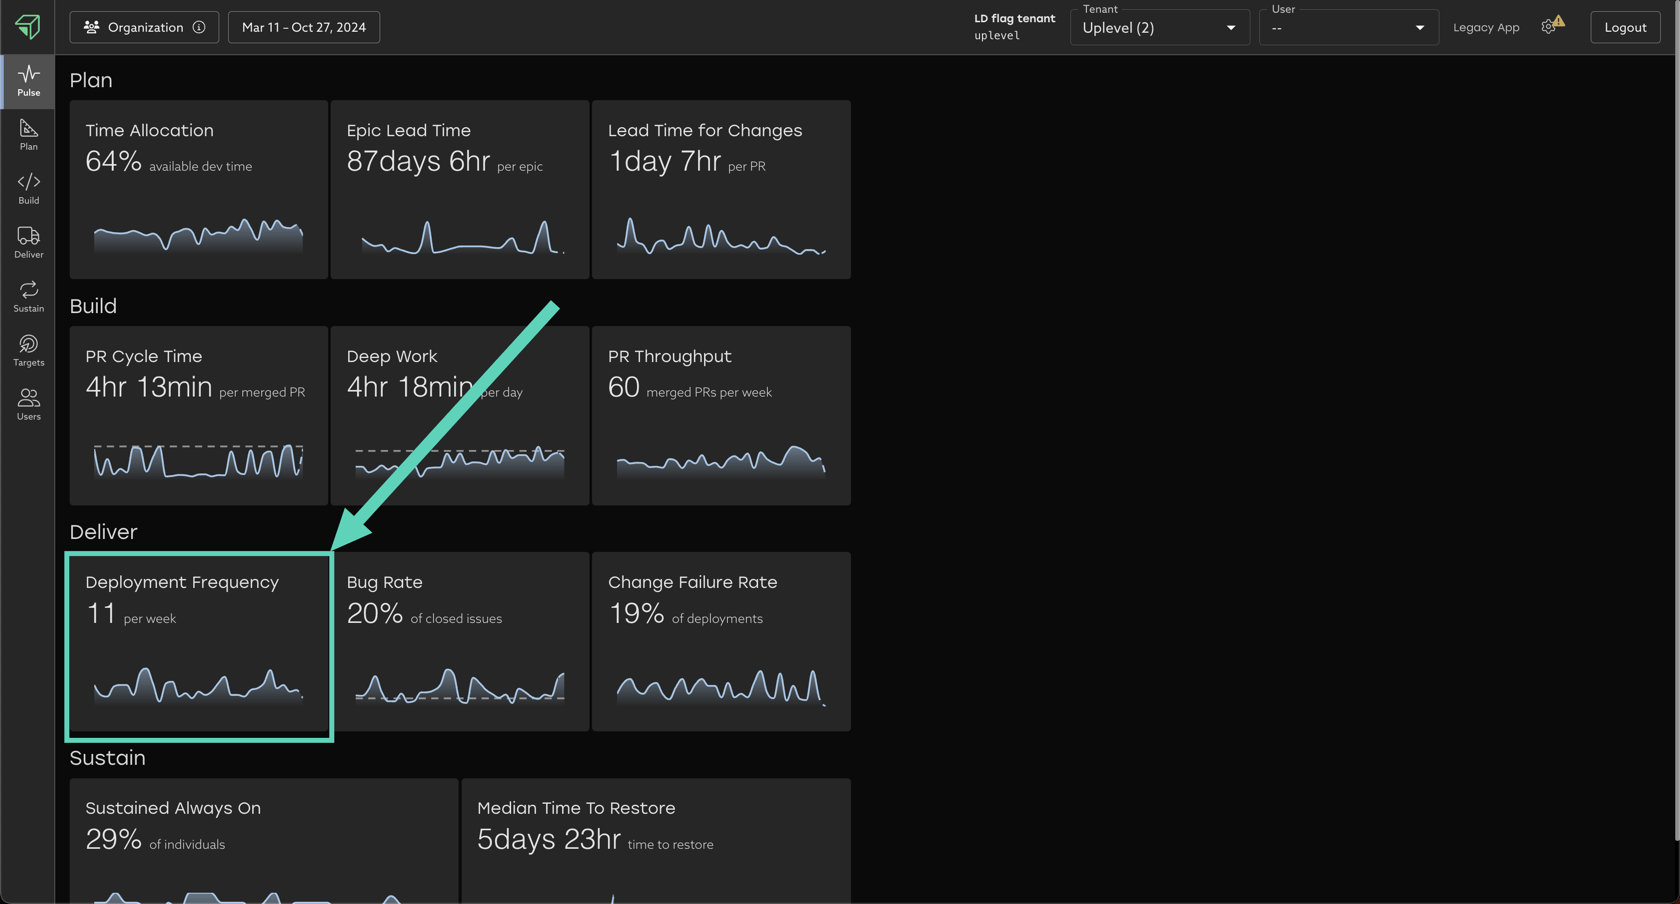
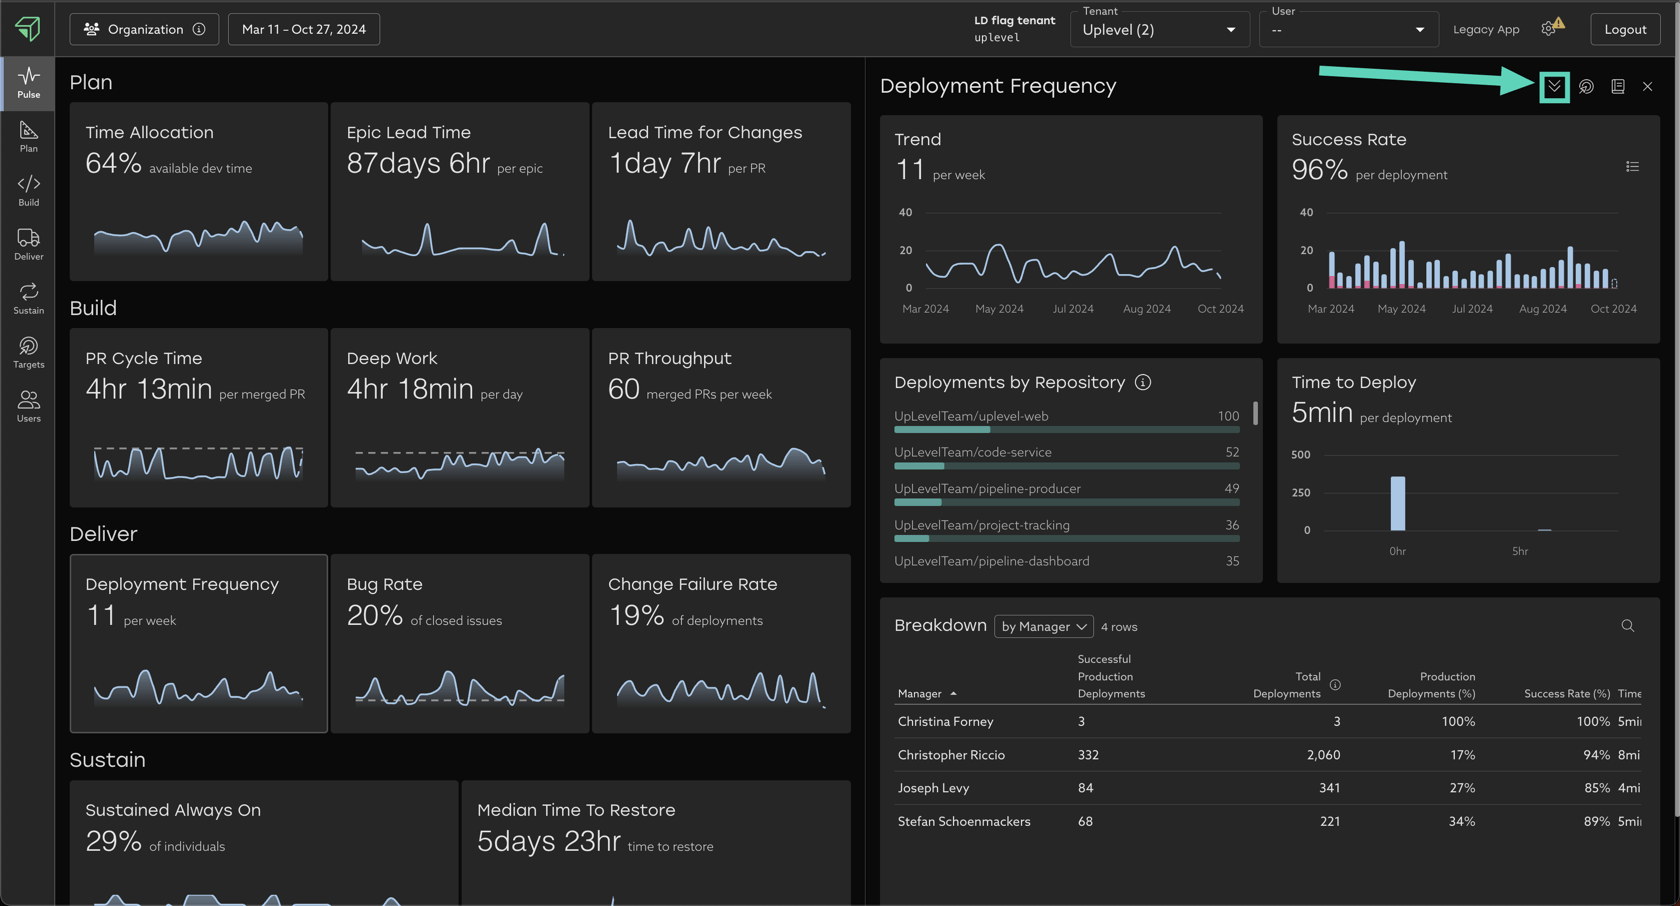
There are no toggles/filters/group by options in Deployment Frequency today. Identical to the examples above, you can explore the Breakdown table at the bottom of the drill-in page to look for unevenness across teams.
Related Articles
Issue Velocity
Learn about your organization's work completion practices and how they've changed over time. What is Issue Velocity? Issue velocity is a measure of the volume of work a group has collectively completed within a given time period, normalized by the ...Issue Velocity Best Practices
How to best use (and not abuse) Issue Velocity data Velocity has taken on several different meanings in the engineering space. Some teams use it to refer to Sprint Velocity (how many story points they'll complete in a sprint), while others focus on ...Uplevel's 2-Week Sliding Calculation Window
Balancing the tradeoffs between leveraging the latest information and maintaining integrity in reporting. Data from your source systems (JIRA/Git/Calendar/Slack/etc.) is fluid. While a JIRA issue may have been classified as a "story" at one point in ...How to find your team's data using default segments
Scope Uplevel to your team By default, Uplevel displays a broad overview of your organization. You may want to narrow down to see a subset of that organization. To choose which set of users are included in that selection, click the Segment dropdown ...How to find low Deep Work time
Learn how to analyze and improve your organization's deep work. Uplevel categorizes your team's work into two buckets: Development time, which consists of Deep Work and fragments. Optimized development time consists of as little fragments as ...