Issue Velocity
What is Issue Velocity?
Issue velocity is a measure of the volume of work a group has collectively completed within a given time period, normalized by the group size. This metric is beneficial for all teams to better understand their ability to consistently complete work, and understand the cadence that that work is completed.
- Weighted Issue Throughput: This is a measure of “how much” work was completed within a period of time. Because teams utilize story points in different ways, this sums story points if they are available, and counts issues without story points as having 1 story point. Filters are available to select different terminal statuses, resolutions, issue types and more to fine tune this measure to the way your team works.
- Team Size: Based on the people-related filters applied, this is the count of people who meet the filter criteria. Time Period: This is the number of weeks within a given date range.
- Time Period: This is the number of weeks within a given date range.
The issue velocity is then calculated as: Weighted Issue Throughput / Team Size / Time Period.

Uplevel recognizes that this weighted average may be good for some teams; however, purely using Story Points might be better for others, so that is shown in the Breakdown Table. Furthermore, teams utilize different issue types, statuses and resolutions for different reasons - all of these can be used to help refine what "done" means in your teams specific context.
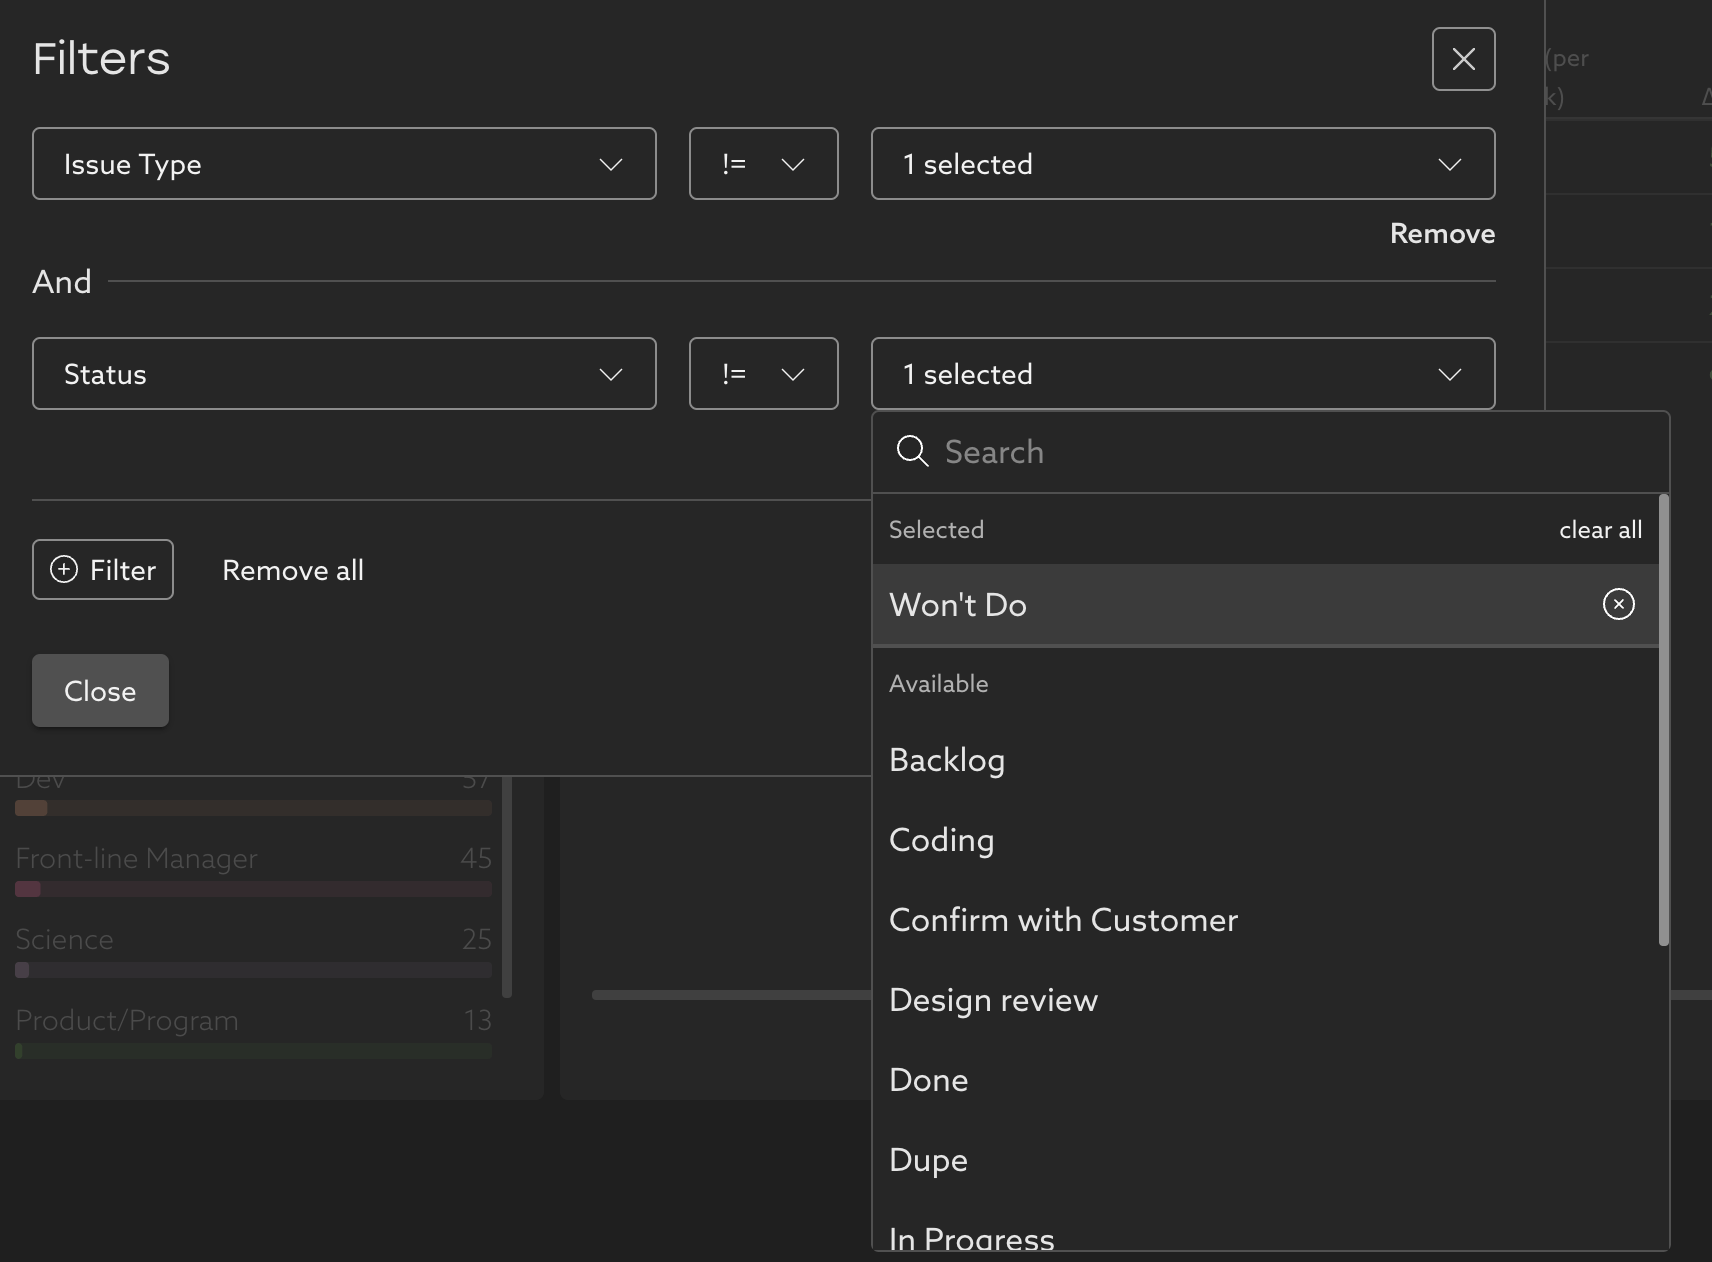
This can be accounted for by setting Issue Type != Sub-task and Status != Won't Do.
Breakdown Table
The breakdown table allows users to see details for their teams including:
- Contributors: The number of people on a given team. Utilize people filters and segments to select the correct set of people.
- Weighted Velocity: Described above.
- ∆(%): The period over period change of velocity.
- Story Points Closed: Sum of story points closed per person per week.
- Issues Closed: Count of issues closed per person per week.
- Story Points (%): Percent of closed issues closed that have story points assigned.
How to use Issue Velocity
Issue velocity can give insight into how your team completes work, which can bolster capacity planning efforts to more accurately scope and predict when work can be worked on and finished. For example, while teams may differ in the value of story points, the act of estimating story points, and breaking up large bodies of work into smaller pieces allows for distribution of work and ensuring well scoped.
Related Articles
Issue Velocity Best Practices
How to best use (and not abuse) Issue Velocity data Velocity has taken on several different meanings in the engineering space. Some teams use it to refer to Sprint Velocity (how many story points they'll complete in a sprint), while others focus on ...How to use Uplevel to find velocity opportunities
The first step towards increasing velocity is finding where your biggest opportunities lie. There are a variety of venues through which opportunities in velocity can be found. Note that affecting/changing velocity comes later, and can be explored in ...ML Issue Classification
How does Uplevel classify Issues? Overview Uplevel’s ML Issue Classification model provides key visibility into engineering effort and time spent on New Feature Development vs. Defects vs. Sustenance without dependencies on how teams are tagging ...Bug Rate
Learn about your organization's bug practices and how they've changed over time. Trend This metric shows the percentage of issues closed during the time period that were bugs. An issue is considered a bug if it has an issue type that contains the ...Allocation Schemes
Definitions of Allocation Schemes, and examples of how they can be used to calculate Time Allocation for your organization. Allocation Schemes (also thought of as Allocation Rules) are used to group similar work items into larger categories to get ...