Epic Lead Time
Overview
Epic Lead Time is defined as the median epic duration, which is calculated as the difference in time from when the epic is created, through to when the epic is closed. This is calculated week over week by when the epic is closed and plotted in the trendline. The top level metric is the median of all epics that were closed within the time range set by the time picker.
The time is broken down into three components:

- Plan: the duration of time between when the epic is created and when the first development action takes place (e.g., a work item moves to In Progress or a PR is created that is linked to an issue in the epic).
- Dev: the duration of time from the first activity through to the last development activity (e.g., a work item closes or final PR activity)
- Close: the duration of time from the last development activity to when the Epic is closed.
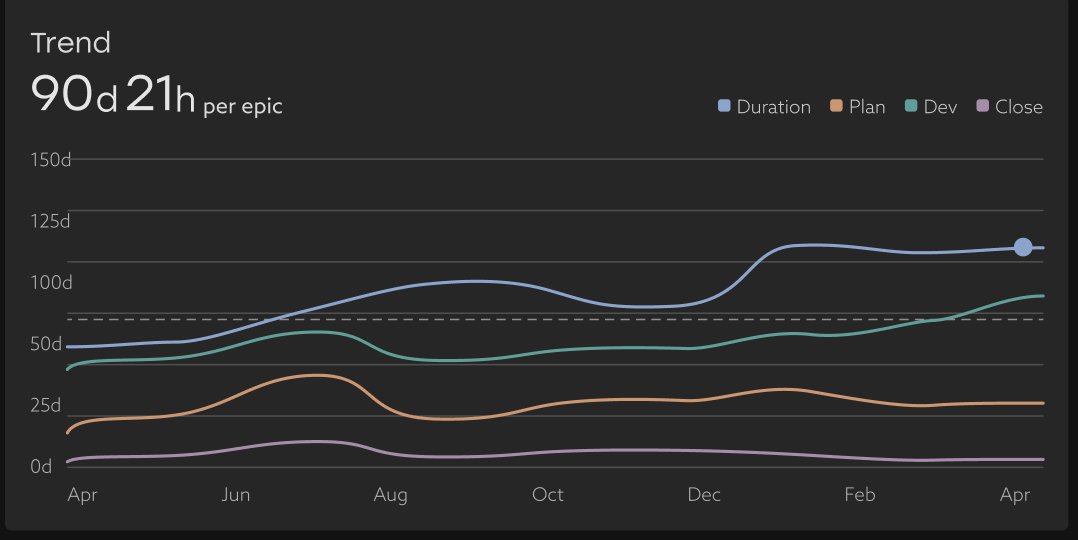
Epic Lead Time by Phase
.png)

- If Plan is the longest, it could indicate that creating requirements takes more time than expected, or that the engineering team has such a long backlog that they don’t get to the work until later than expected.
- If Dev is significantly longer than expected, it could mean that the requirements were unclear, requiring back and forth between Product / Design / UXUI / etc., to scope out what is actually to be built.
- If Close is longer than expected, this could indicate that there are some final trailing blockers or items that are preventing the team from simply closing out the epic.
Breakdown
.png)
The table breaks down:
- Duration: the duration of time between epic creation and the epic being closed, as well as the three phases described above
- Effort: this metric leverages Uplevel’s Time Allocation insights to compute how much development effort went into a specific epic while it was open.
- Example 1: One developer who spends 50% of their time in meetings, and all of their available working time on this project for a week would contribute 0.5 dev weeks of effort.
- Example 2: A 5-person scrum team with on average 70% available development time working for 10 weeks on an epic would contribute (0.7 x 5 devs x 10 weeks) = 35 dev weeks of effort to this Epic.
- Add-on - this metric also leverages Uplevel’s Time Allocation insight to compute how much development effort went into a specific epic after it was closed. This can help scope how much long-tail effort went into an epic that was already ‘finished’.
Key questions to ask using this data
- How long does it really take to plan and deliver a new feature?
- Are there bottlenecks in our planning or development process that make this process slower than it needs to be - perhaps because of unclear requirements
- Are we speeding up or slowing down in delivering our commitments?
Tip:
Look to the Effort and Add-On columns to understand the context of long running epics. It may be that the epic was simply a very large body of work that took a lot of effort to complete - or maybe it was a small body of work that was continually deprioritized in favor of other initiatives.
Open Epics
.png)
Some may be ongoing epics that are used to capture work that never has a finite end, like a “Customer Support” epic or “General Bugs and Polish." Others are epics that are currently in progress in one state or another. This can help give a sense of what a specific set of people are currently working on (and even suggest places to do some clean-up efforts).
Frequently Asked Questions (FAQ)
- Why is X Epic showing for this team?
An epic will appear for a team or teams if any individual IC on that team had effort towards an epic. For some highly cross-functional teams, this may be a small bit of effort across many epics. To gain further insight around this, we recommend heading over to the Plan page to gain insight into what that team worked on during specific time periods.
Related Articles
Lead Time for Changes
How does Uplevel define Lead Time for Changes? The DORA metric Lead Time for Changes is measured as the median duration of time from first commit until the Pull Request is deployed to a production environment using CI/CD Data. This differs from Cycle ...Understand your team's Lead Time for Changes
Learn how to navigate your organization's Lead Time for Changes data and how you can take action to mitigate risk Trend Learn about your organization by analyzing your Lead Time for Changes trend over time. With this view, you can easily see where ...Time Allocation
How does Uplevel calculate Time Allocation for my teams? What is Time Allocation? Time Allocation is a specific Uplevel insight that provides an automated, up-to-date breakdown of where your organization’s time and efforts are spent. As a pivotal ...PR Cycle Time
Understand the flow of a PR from commit to merge PR Cycle time measures the median time your Pull Requests are in three different stages: Dev, Waiting, and Review. Phase 1: Dev The first phase looks at how long the particular PR was in development. ...How to decrease your team's unallocated time
Tips and best practices to get a more complete picture of your organization's investments in Time Allocation Uplevel's Time Allocation metric combines signals from calendar, chat, project tracking (Jira) and version control systems (git) to estimate ...