PR Throughput
What is PR Throughput?
PR Throughput counts the number of merged PRs a group has collectively authored in a given time period. It is an indication of how frequently code changes occur, and whether that comes in a consistent cadence. PR throughput is helpful for all teams to better understand their ability to consistently deliver code. To go a layer deeper and explore the team’s ability to deliver to end users, take a look at the Deployment Frequency metric that leverages CI/CD data.

Example of PR Throughput:
If 5 PRs are merged to a Staging branch, and then these are pushed to the Production branch with an additional pull request, that would count as 6 PRs merged.
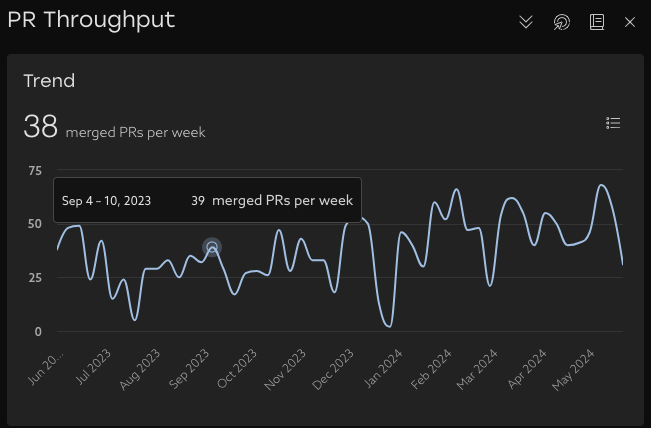
Trend
See your organization's throughput trend over time. This chart shows the number of PRs merged throughout the date range selected.
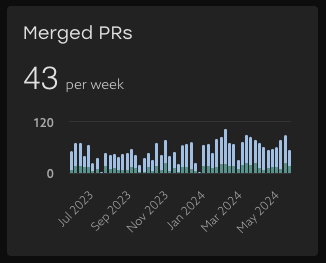
Merged PRs
Leverage this view to understand whether PRs are Complex to Review or were Delayed in the development process.

Definitions
Complex PRs
PR complexity is calculated by looking at the number of lines added and deleted, number of files, and refactors. Each PR is estimated to be either “Complex” or “Not Complex” to review in this metric, and is measured to have low, medium, or high complexity.
Delayed PRs
Two factors determine whether a PR has become “delayed” - the PR Complexity, as well as time spent in the Waiting / In Review phases. The table below shows how long a PR must be stuck in review to be considered delayed based on its complexity.
| PR Complexity | Delayed After |
| Not Complex | 3 business days |
| Complex | 5 business days |
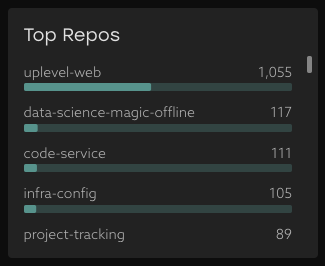
Top Repos
Understand where your teams are merging code. This chart shows the top repos by number of PRs merged, and what fraction that represents for your team.
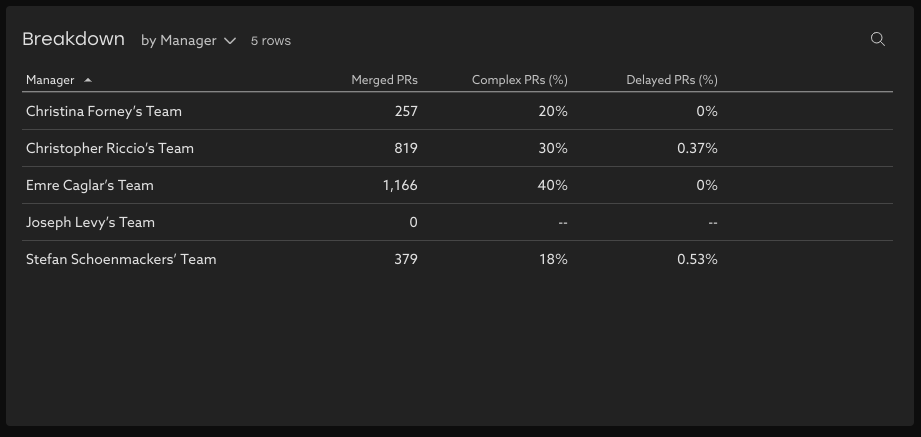
Breakdown Table
Pivot the data to understand how many PRs are merged by different groupings, as well as PR Complexity and what fraction of PRs were delayed along the way.
Related Articles
PR Cycle Time
Understand the flow of a PR from commit to merge PR Cycle time measures the median time your Pull Requests are in three different stages: Dev, Waiting, and Review. Phase 1: Dev The first phase looks at how long the particular PR was in development. ...How to find bottlenecks slowing down PRs
Learn how to navigate your organization's Cycle Time data and how you can take action to mitigate risk Trend Learn about your organization by analyzing your cycle time trends over time. With this view, you can easily see where delays happen and take ...How to use Uplevel to find velocity opportunities
The first step towards increasing velocity is finding where your biggest opportunities lie. There are a variety of venues through which opportunities in velocity can be found. Note that affecting/changing velocity comes later, and can be explored in ...Lead Time for Changes
How does Uplevel define Lead Time for Changes? The DORA metric Lead Time for Changes is measured as the median duration of time from first commit until the Pull Request is deployed to a production environment using CI/CD Data. This differs from Cycle ...Issue Velocity
Learn about your organization's work completion practices and how they've changed over time. What is Issue Velocity? Issue velocity is a measure of the volume of work a group has collectively completed within a given time period, normalized by the ...