How to find bottlenecks slowing down PRs
Learn how to navigate your organization's Cycle Time data and how you can take action to mitigate risk
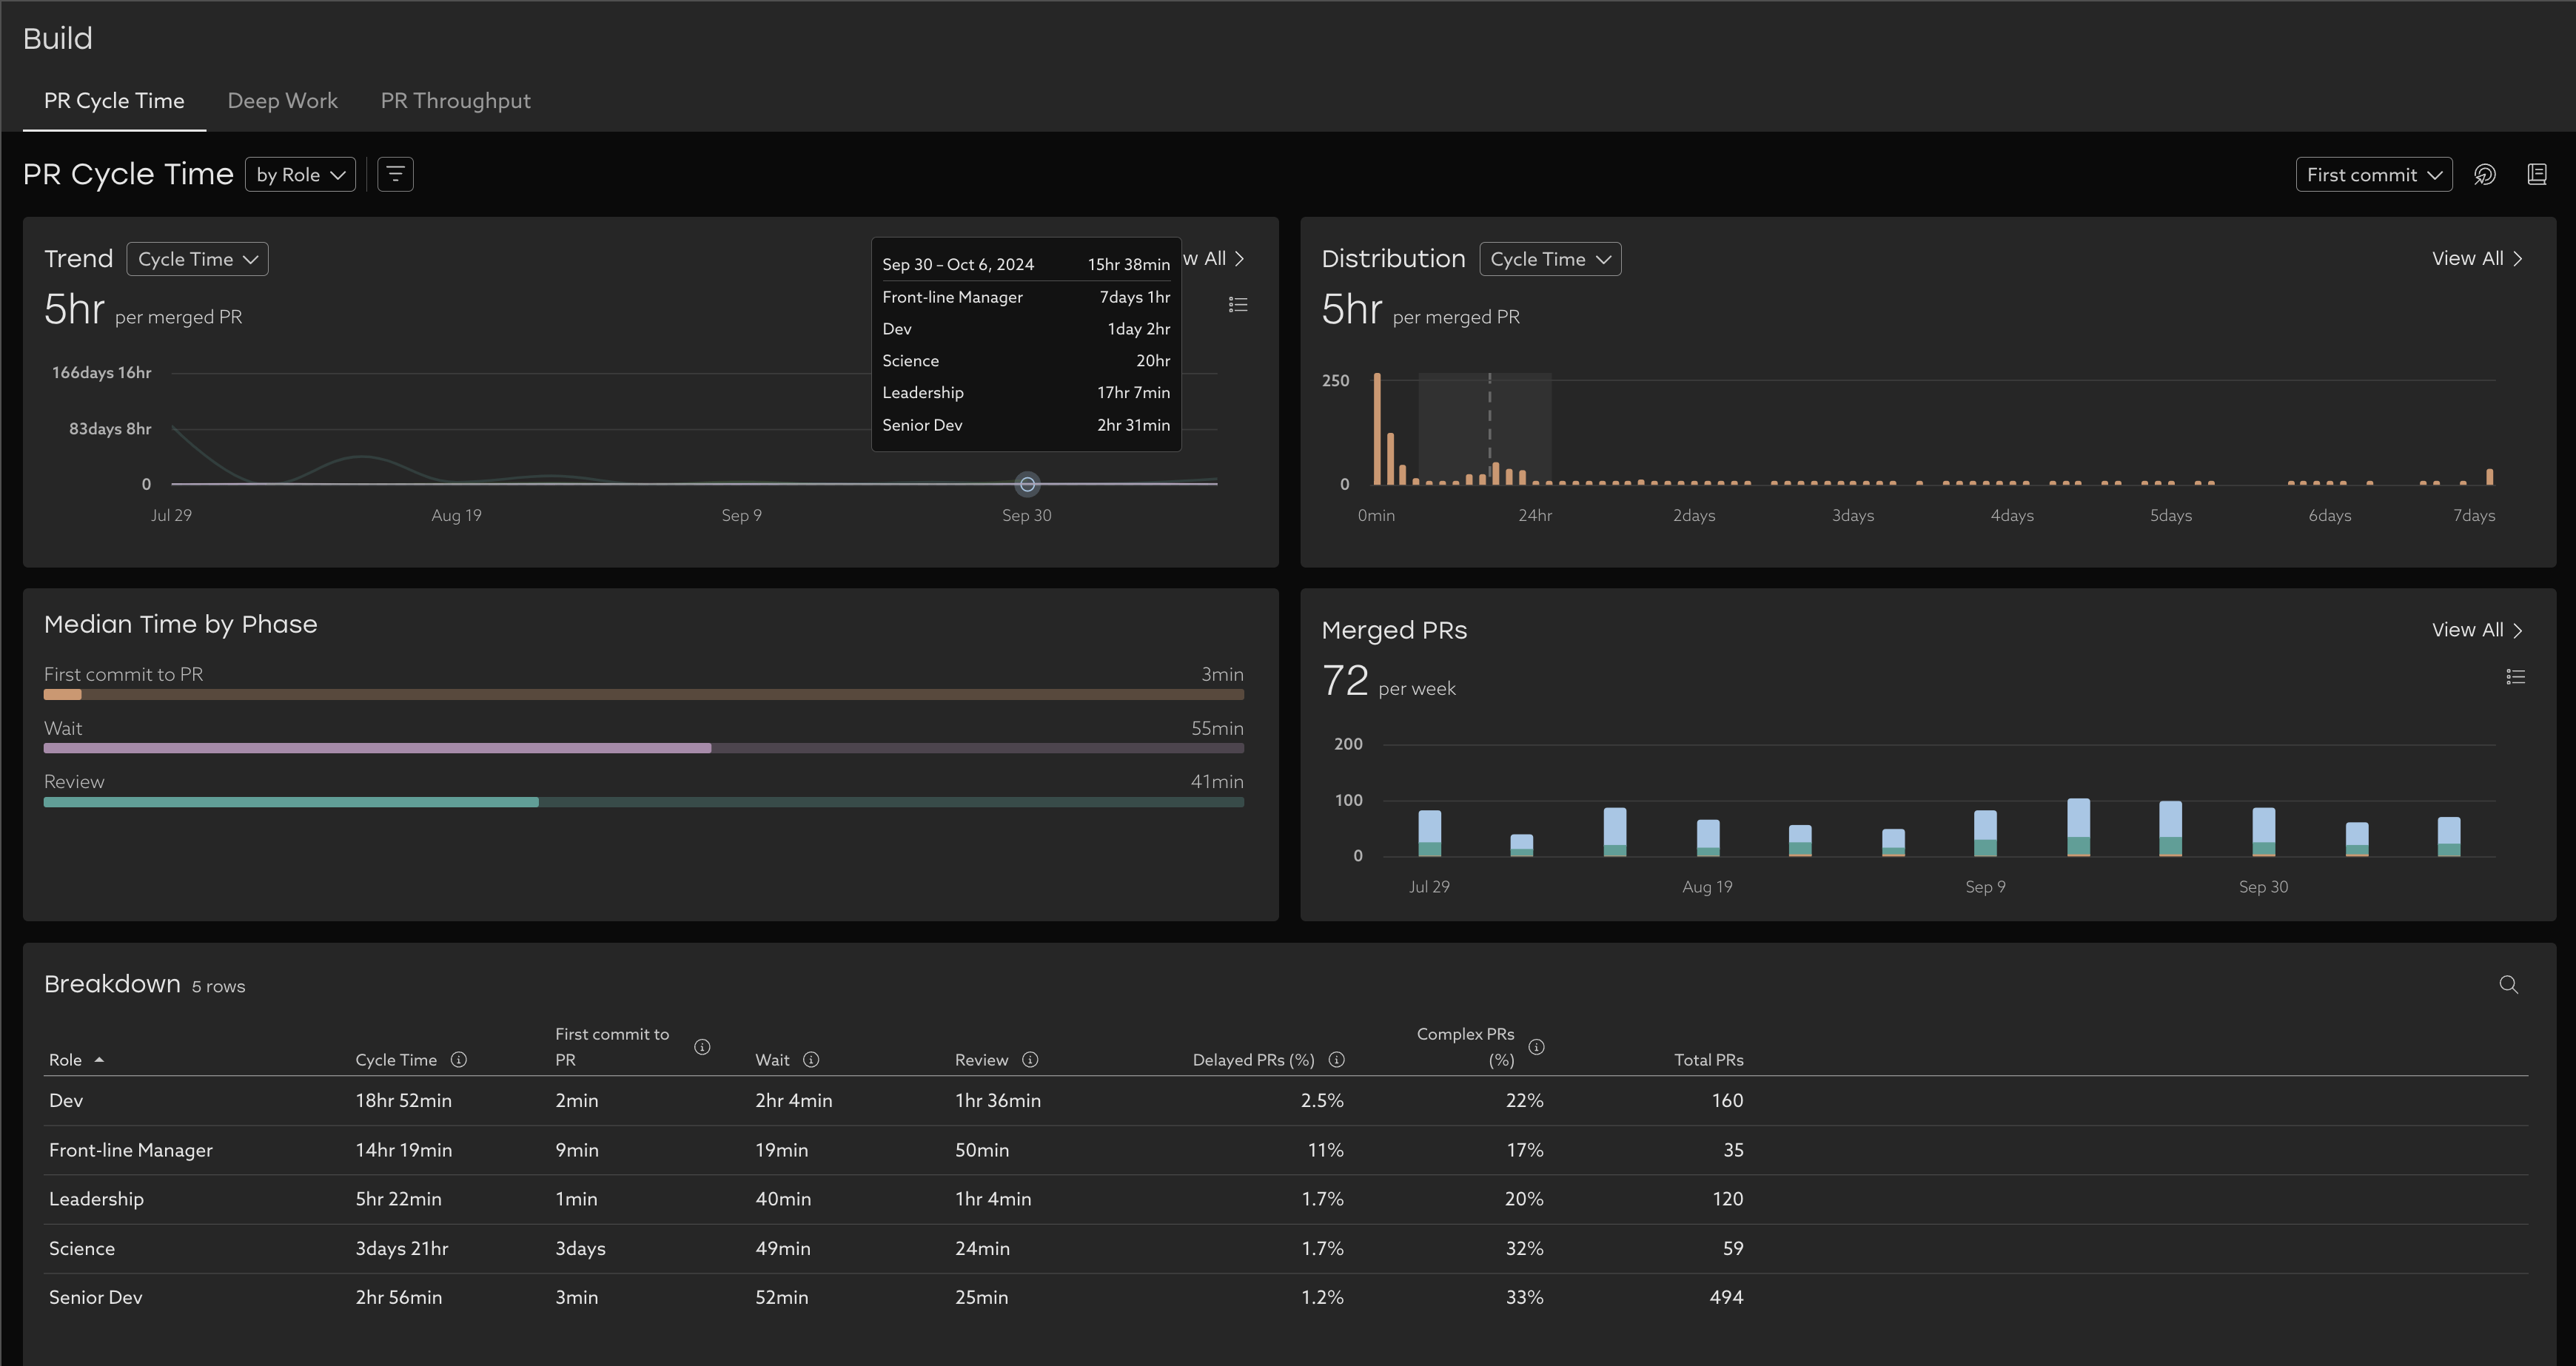
Trend
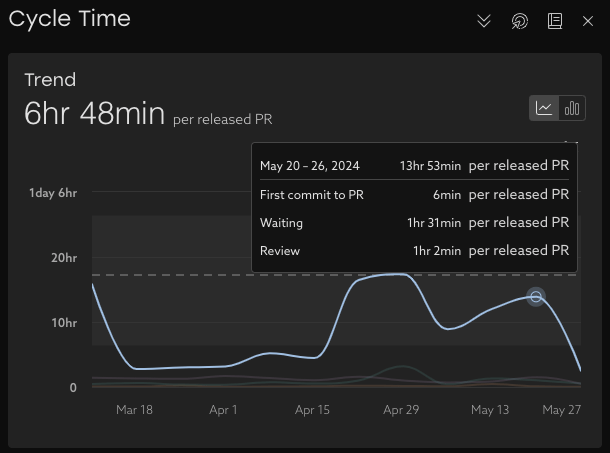
Learn about your organization by analyzing your cycle time trends over time. With this view, you can easily see where delays happen and take action. Each line represents a stage in the process.

Tip: encourage your developers to submit smaller PRs more often. This will keep everyone in the practice of merging frequently and will take less time to review.
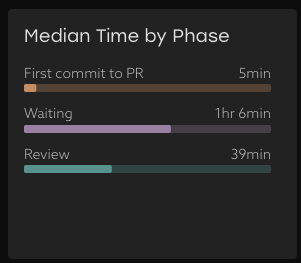
Median Time by Phase
See exactly how much time is allocated to each phase for the time period selected. Compare this to your trends over time to see how you're tracking.
PR Throughput
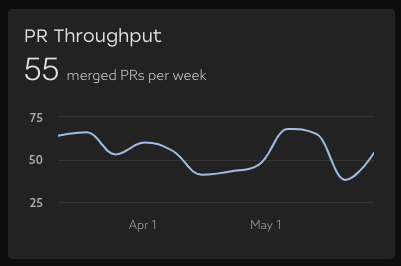
This chart shows how frequently your team is merging PRs . The key to this metric is consistency and keeping a solid cadence. To learn more - explore our dedicated PR Throughput view.
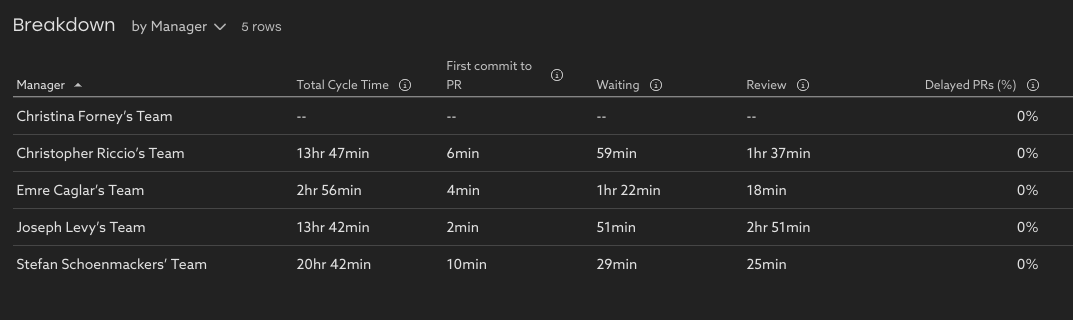
Breakdown Table
Drill down further by using the breakdown table. This view lets you dig in further to understand which teams might need support by pivoting on various people properties like Report Group or Role, or by Repository. A "null" value means that team didn't have any PRs for that time period.
This table provides helpful context to understand the Cycle Time Trends, like Delayed PRs (% of PRs that took longer than expected from opened to merged based on complexity), and Complex PRs (% of PRs that are estimated to be complex to review).
To drill in further, click a row of the table to explore the data in depth by looking the list of PRs .
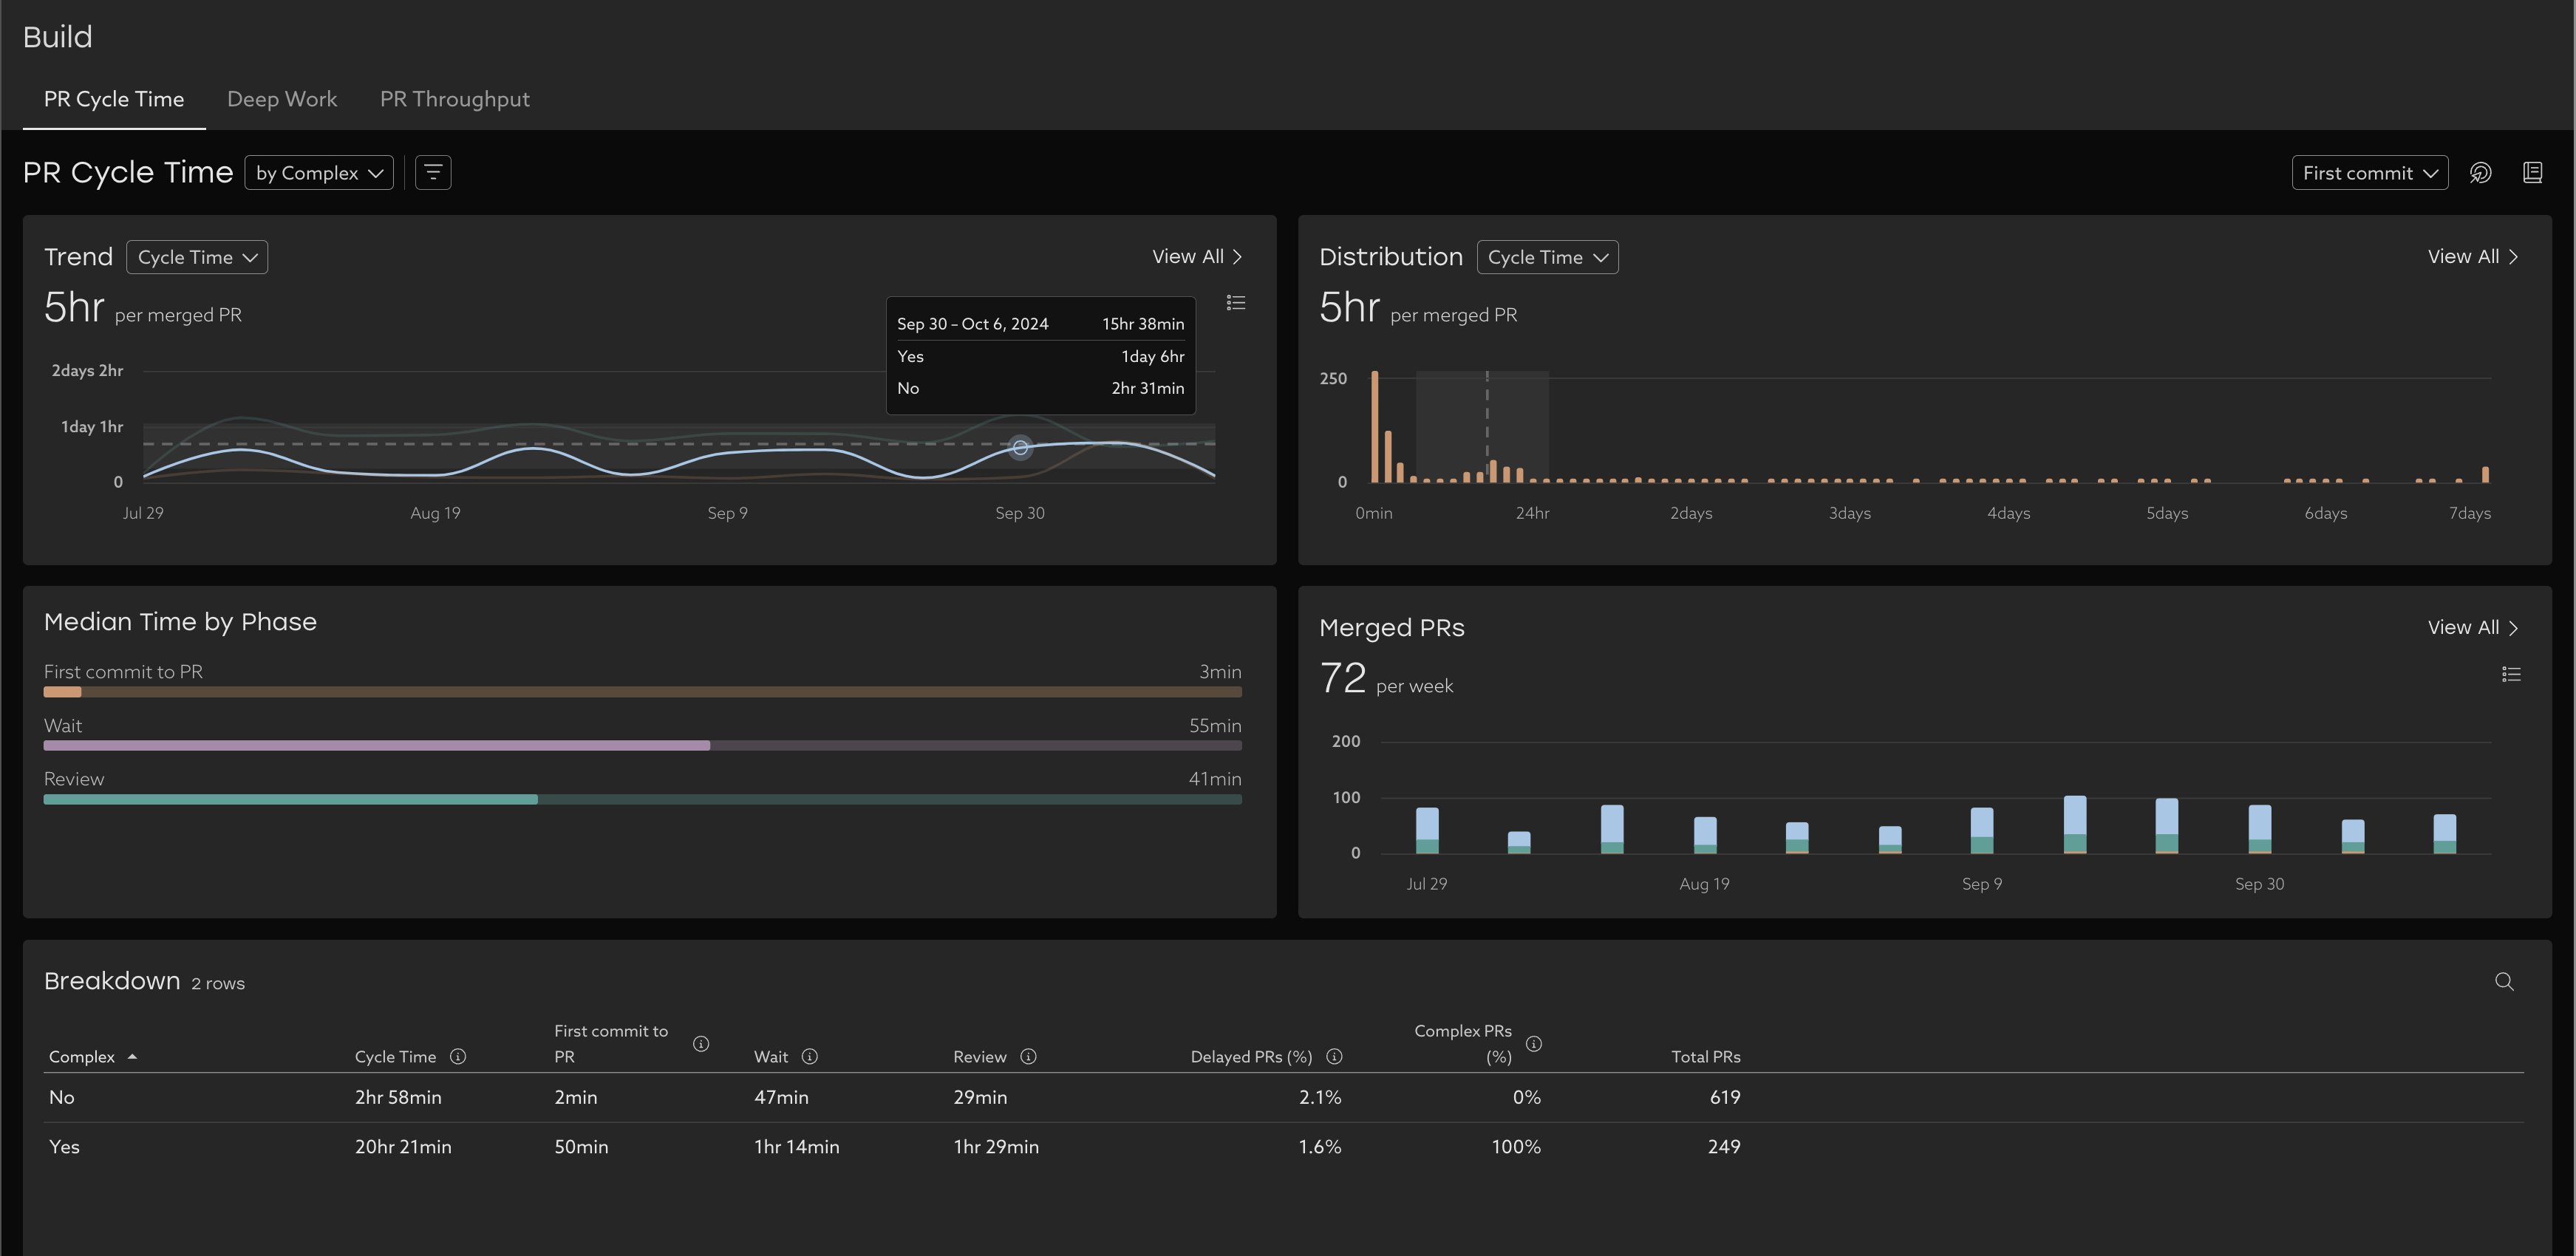
Compare trends
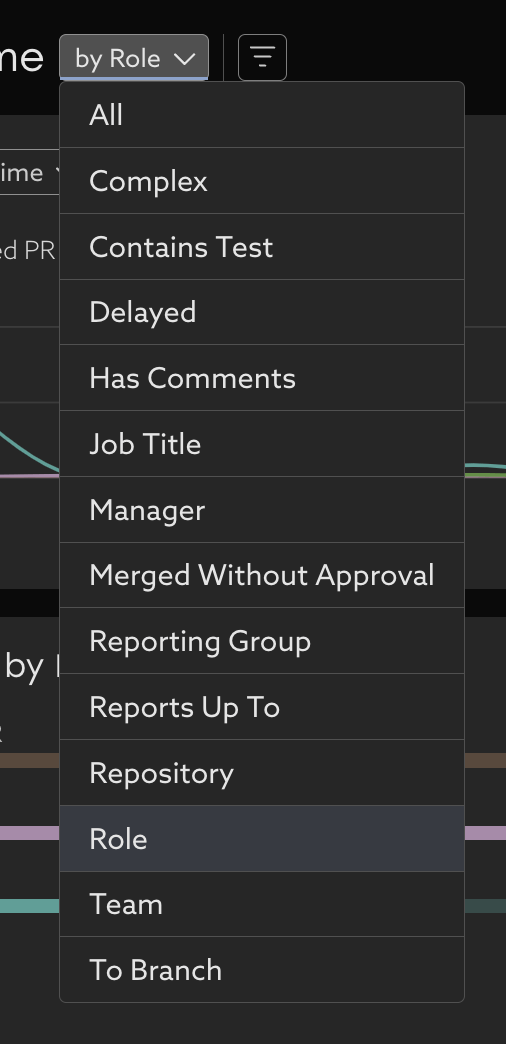
Group PR Cycle Time by different attributes to compare trends of different attributes such as:
- By role - is there a difference in cycle time phases between Devs and Senior Devs?
- By complexity - What's the impact of complex PRs on cycle time?
- With many more options:
Related Articles
How to use Uplevel to find velocity opportunities
The first step towards increasing velocity is finding where your biggest opportunities lie. There are a variety of venues through which opportunities in velocity can be found. Note that affecting/changing velocity comes later, and can be explored in ...How to find your team's data using default segments
Scope Uplevel to your team By default, Uplevel displays a broad overview of your organization. You may want to narrow down to see a subset of that organization. To choose which set of users are included in that selection, click the Segment dropdown ...How to find low Deep Work time
Learn how to analyze and improve your organization's deep work. Uplevel categorizes your team's work into two buckets: Development time, which consists of Deep Work and fragments. Optimized development time consists of as little fragments as ...Lead Time for Changes
How does Uplevel define Lead Time for Changes? The DORA metric Lead Time for Changes is measured as the median duration of time from first commit until the Pull Request is deployed to a production environment using CI/CD Data. This differs from Cycle ...Epic Lead Time
Understand the bottlenecks in your planning process by looking at your Epic Lead Time phases Overview Epic Lead Time is defined as the median epic duration, which is calculated as the difference in time from when the epic is created, through to when ...