How to Understand Your Organization's Top-Level Investments
One consistent problem we've heard from engineering leaders is that they can't create a unified view of their data that lets them understand their investments without costly initiatives to clean up Jira.
For this reason, Uplevel created the Machine Learning (ML) Issue Classifier.
To find your team's top-level investments (New Value Creation, Sustenance, and Defect Work), head to the Plan page and select the "ML Issue Classification" rule.
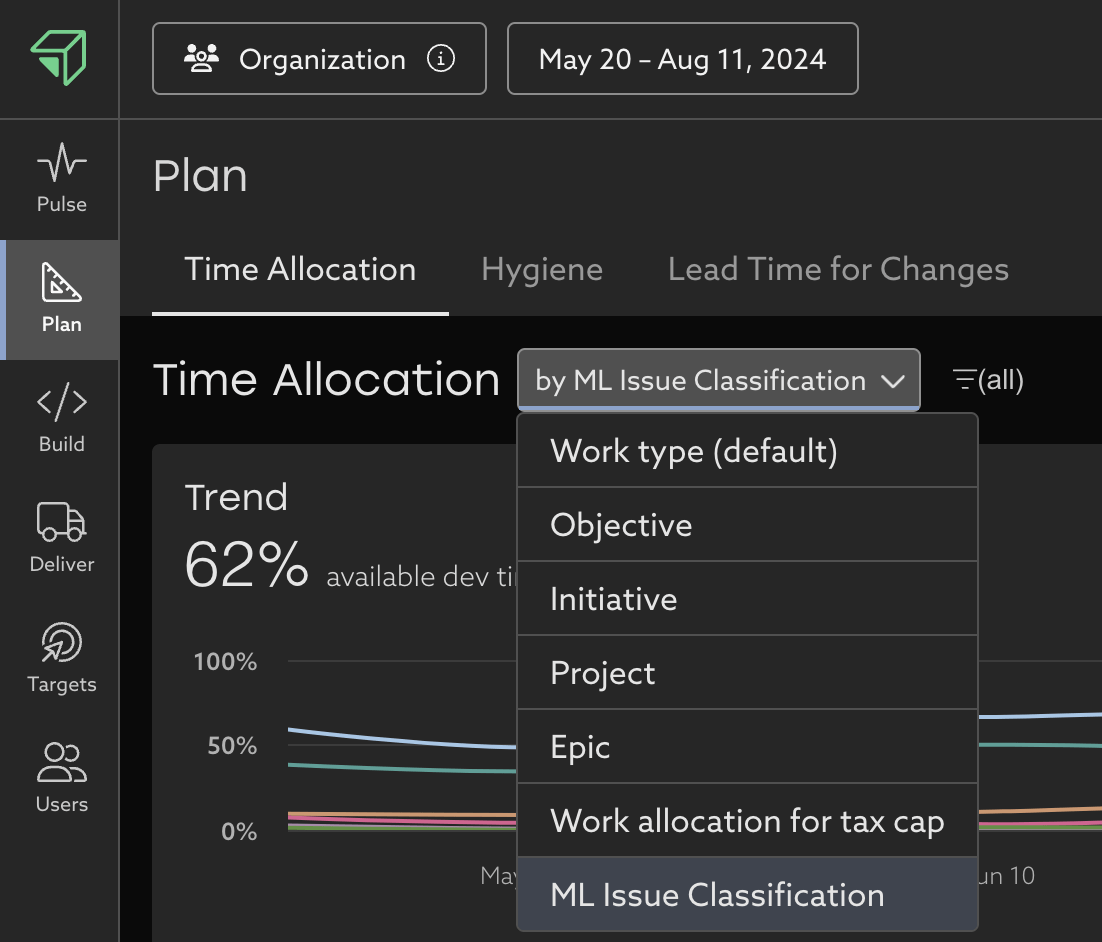
From here, track how your team's time investments to answer questions like:
- Are we investing enough in new feature work? Track how New Value Creation has trended over time and set a target for your organization.
- Why is New Value Creation low? Is it because too much work is going towards Sustenance like Keep the Lights On projects? These tend to quietly detract from an organization's focus because the team gets "used to it."
- Has defect work started to creep up over the past quarter? This may be a sign the team in need of some dedicated tech debt reduction?

Example:
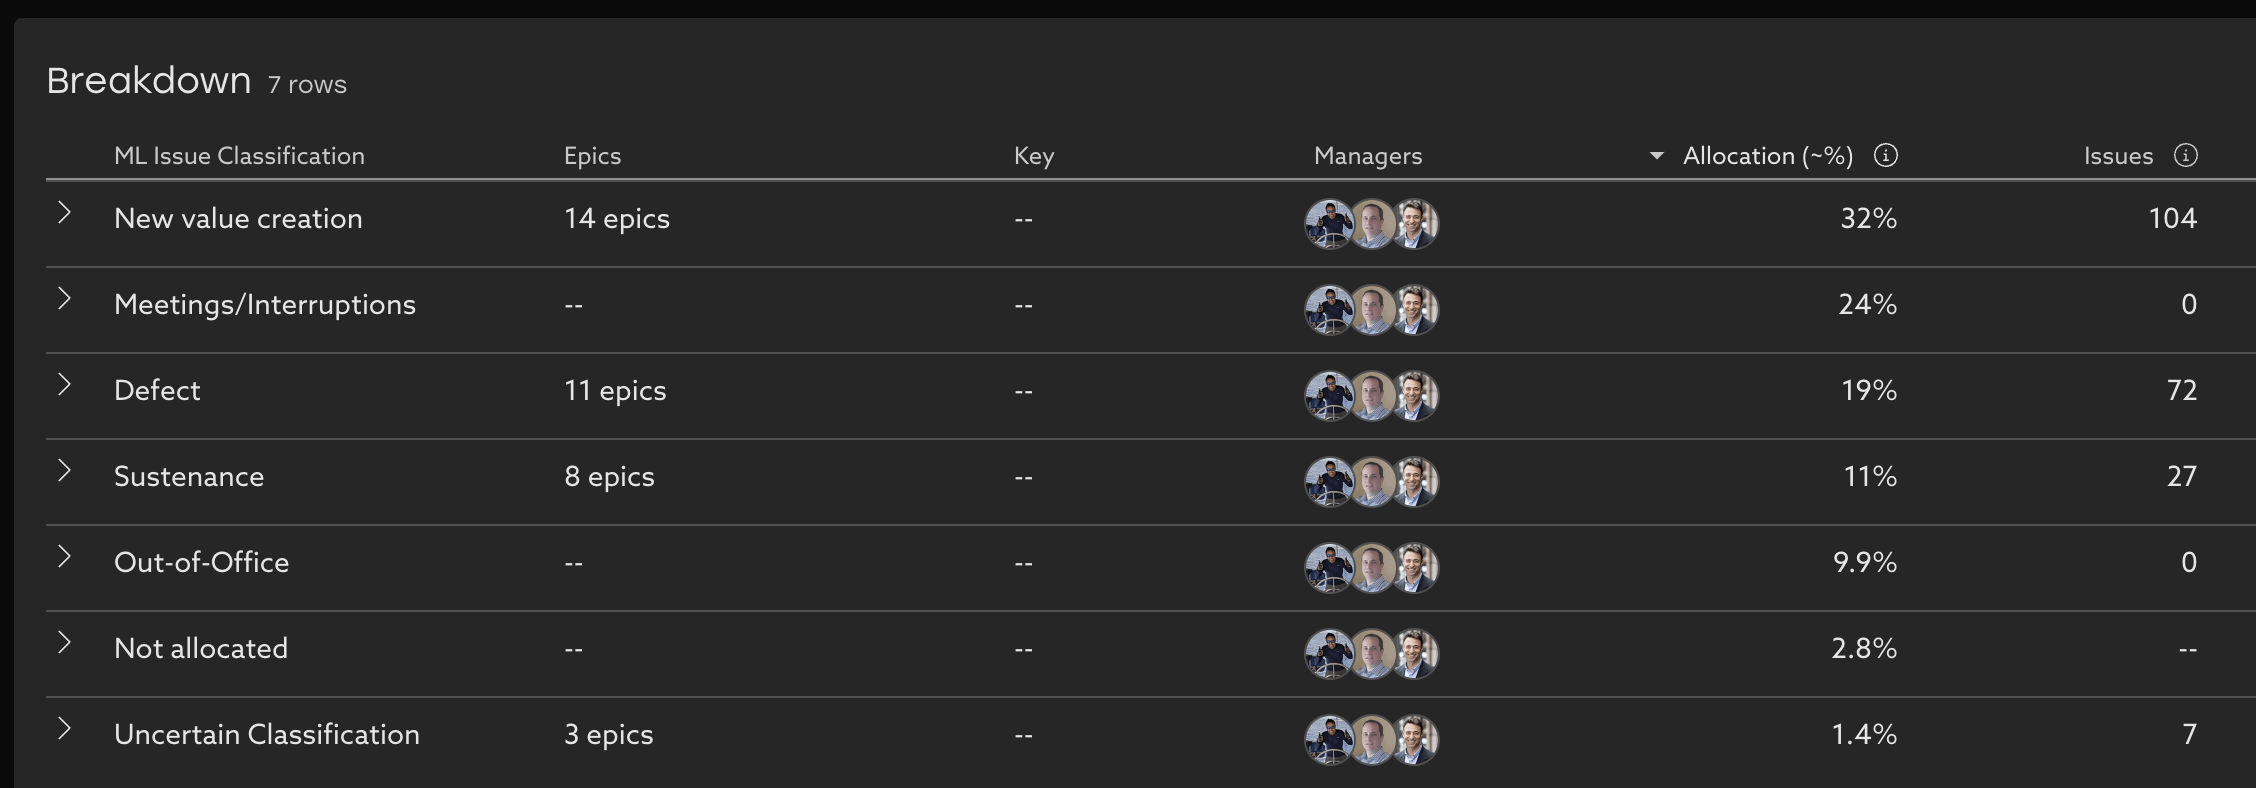
For this team, the past month been a push to get several new features out the door and into customers' hands. It's great to see that New Value Creation is the top level investment with 32% of time going towards that. However, we want to keep an eye on work on Defects (19%) and Sustenance (11%), which are comparable to New Value Creation when combined.
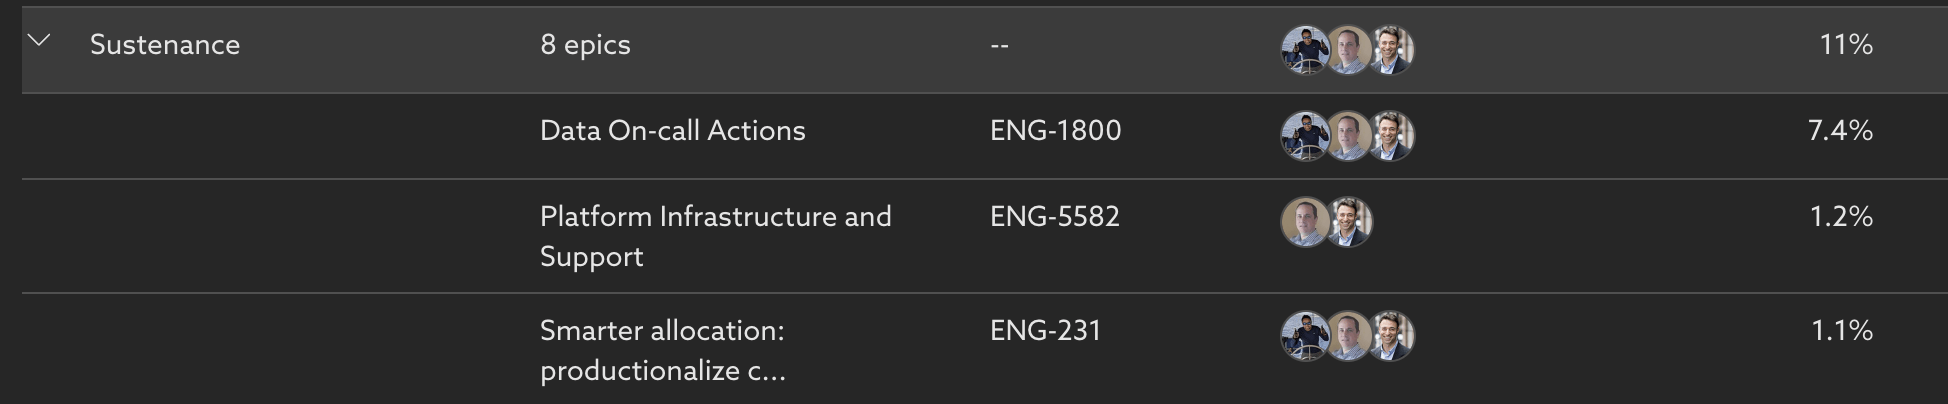
This period was planned to be mostly new feature work for this team, so it's a bit concerning to see that Sustenance is taking up 11% of the team's time. To see where that investment went, we then click into the Sustenance category. We see that it's on-call work that's comprising the majority of the Sustenance work, followed by an ongoing infrastructure project that should be wrapping up soon. It's a surprise that that on-call was taking up that much effort, and merits a conversation to see if there are opportunities to reduce the on-call load and automate some of those processes.
Related Articles
Understand your team's Lead Time for Changes
Learn how to navigate your organization's Lead Time for Changes data and how you can take action to mitigate risk Trend Learn about your organization by analyzing your Lead Time for Changes trend over time. With this view, you can easily see where ...Pulse Page
Understanding important changes over time at a glance Metric Trends on the Pulse Page highlight the insights with the largest recent change, to highlight where focus is needed, and where efforts to improve are showing the biggest impact. It's ...PR Throughput
Learn about your organizations code delivery practices and how they've changed over time. What is PR Throughput? PR Throughput counts the number of merged PRs a group has collectively authored in a given time period. It is an indication of how ...Deployment Frequency
What is Deployment Frequency? Deployment Frequency uses your Github Actions data to calculate the number of successful deployments to production a group of people has in a given time period. It is an indication of how frequently and consistently ...How to decrease your team's unallocated time
Tips and best practices to get a more complete picture of your organization's investments in Time Allocation Uplevel's Time Allocation metric combines signals from calendar, chat, project tracking (Jira) and version control systems (git) to estimate ...