AI Impact Insights
Your developers are already using AI. By sending usage data to Uplevel, key metrics can be compared against cohorts of your developers to analyze the changes AI is driving at your organization.
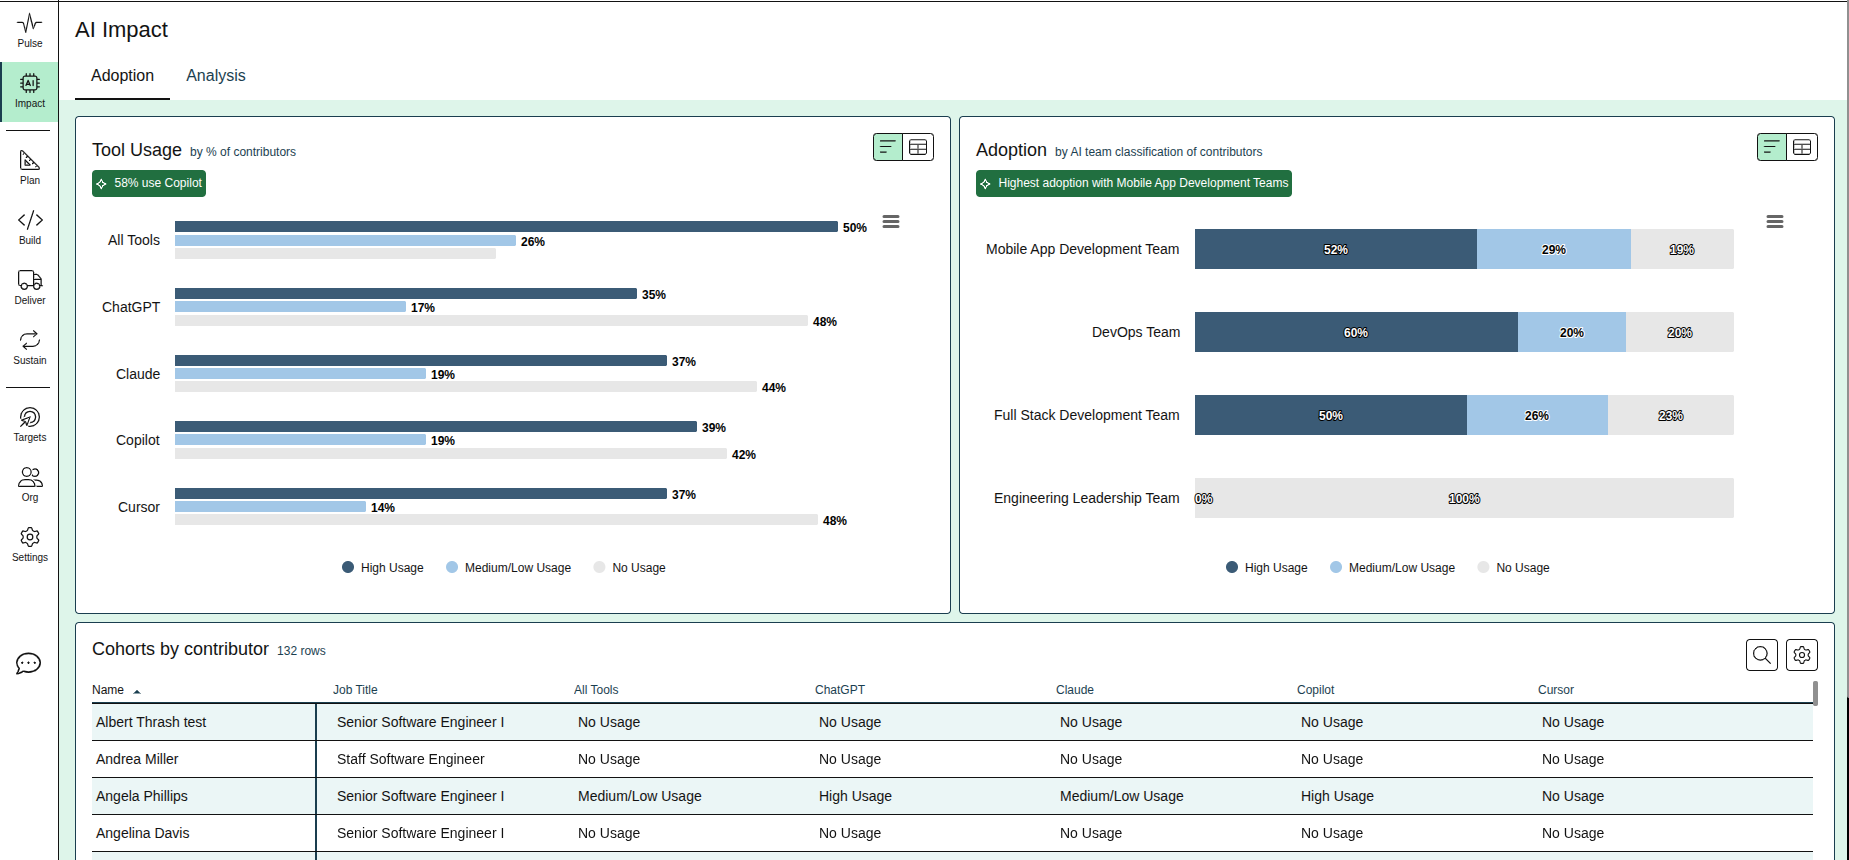
Adoption
Usage of AI tools will differ based on the efficacy of the tool for the role of the developer. Compare usage between tools and different types of engineering teams to understand where and how AI is being used.
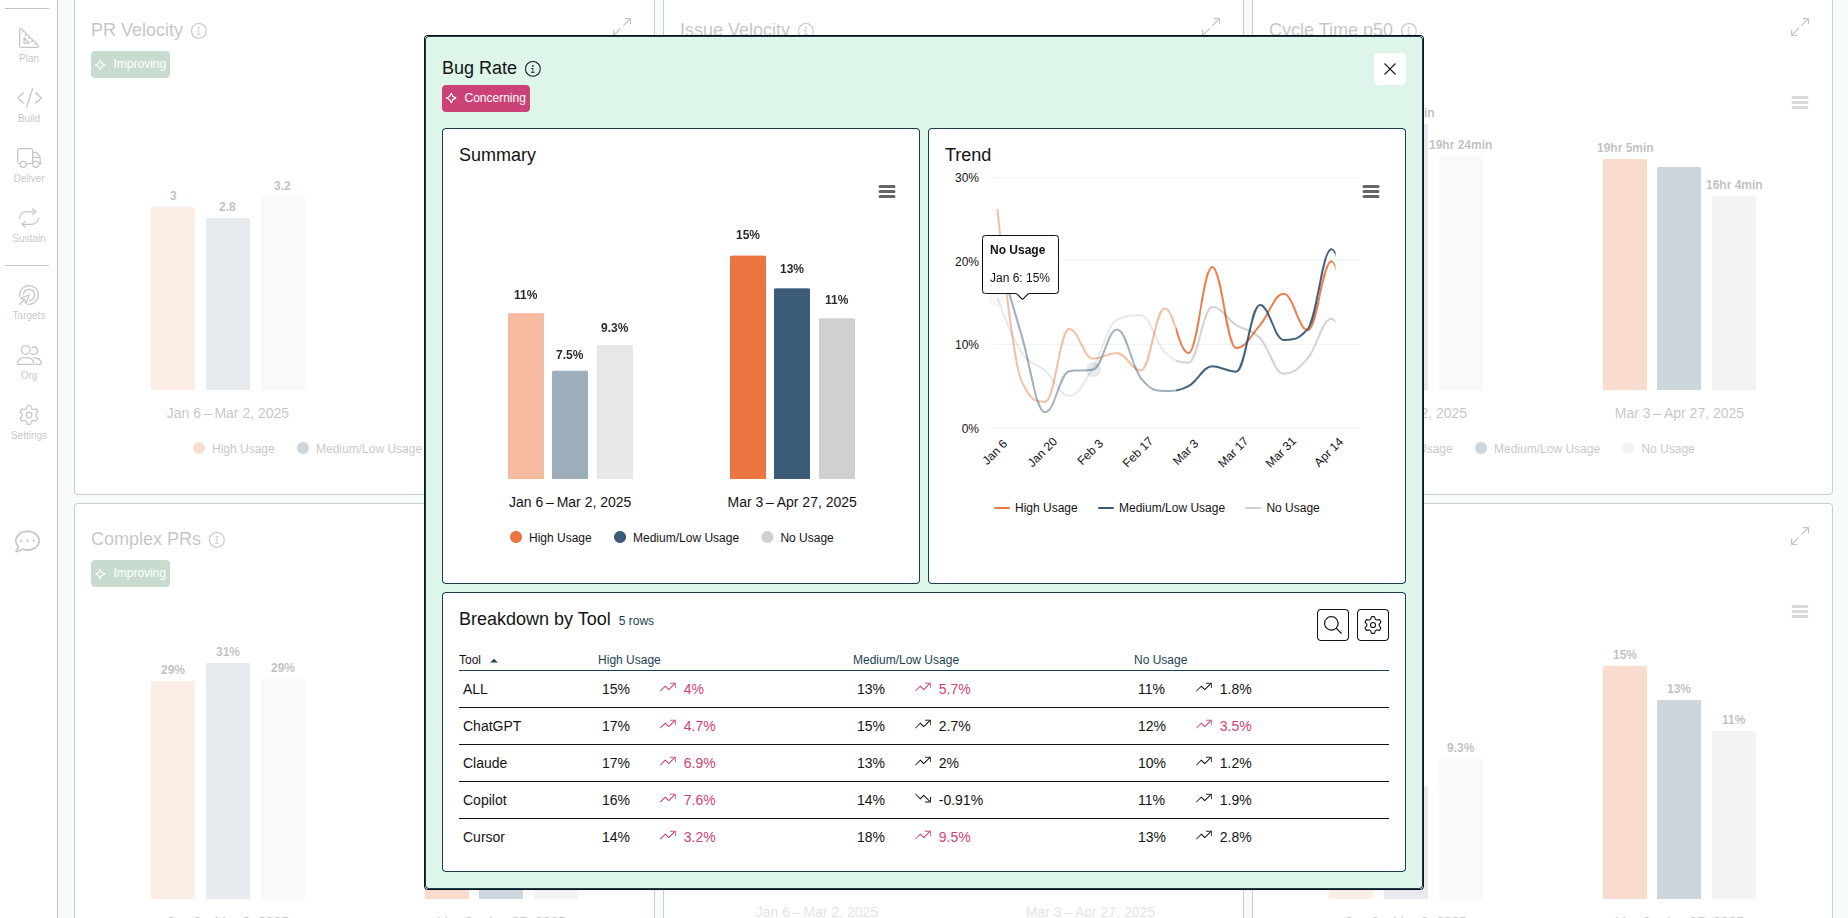
Analysis
See how key metrics have changed for each cohort over time. Evaluate trends in behavior to see if changes are correlated to AI usage.
Sending Data to Uplevel
To form cohorts of developers, Uplevel needs per-person usage data for each tool we evaluate. Cohorts are assigned based on the snapshot of data, and can be updated over time as new data is provided.
Related Articles
AI Investment Summaries
Understand details of what your team has been working on at a glance What are AI Investment Summaries? Shown on the Pulse Page, AI Investment summaries are now available for all allocation schemes. These summaries give engineering leaders a short ...Pulse Page
Understanding important changes over time at a glance Metric Trends on the Pulse Page highlight the insights with the largest recent change, to highlight where focus is needed, and where efforts to improve are showing the biggest impact. It's ...How to find bottlenecks slowing down PRs
Learn how to navigate your organization's Cycle Time data and how you can take action to mitigate risk Trend Learn about your organization by analyzing your cycle time trends over time. With this view, you can easily see where delays happen and take ...How to set a metric target
Set targets for metrics and teams to help drive change in your org. Targets can now be set on any key insights directly within the dashboard. This feature is designed to empower every team to actively participate in setting goals and tracking ...How to explore your data with "Group by" options
Insights data can be pivoted by key properties in order to view differences between groups. Imagine that Uplevel insights show a high-level trend across all the people in your selected segment. Clicking into the details provides a Table view with ...